Newsletter

It’s All Relative

Active versus passive investing

CFA Institute defines passive investing as “any rules-based, transparent, and investable strategy that does not involve identifying mispriced individual securities”. In essence, passive investing involves replicating a market index, such as the MSCI World or S&P 500, or following a defined set of rules; it does not take into account the unique objectives and needs of the investor and relies on the market’s efficiency in appropriately pricing the index’s holdings. In contrast, active investing relies on a “portfolio manager… identify[ing] and differentiat[ing] between the most attractive…and least attractive securities” (CFA Institute).

In our view, active investing is slightly more complicated than the definition above. It focuses on the development of an investment plan, based on an investor’s mandate, which is constructed from the investor’s unique investment objectives and needs. As such, we would define active investing as constructing a portfolio (which may or may not deviate from the benchmark) which is aligned to each investor’s specific requirements. Active portfolio management will not outperform a passive strategy over all time periods, but aims to do so over the defined investment time horizon while minimising the risk of an investor not meeting their objectives and needs.

Proponents for both sides of the passive versus active debate primarily focus on performance and fees, while the concept of risk management is often overlooked. It could be argued that where investors have unique investment objectives and needs, an active approach would be more beneficial.

Active portfolio management

Each client has unique needs and investment objectives. These needs and objectives are reflected in the Investment Policy Statement (IPS) or mandate of a client, and an investment plan lays out a strategy to meet these needs and objectives. Effective portfolio management includes monitoring and reviewing this strategy and its effectiveness in meeting these needs and objectives, as well as updating the strategy where applicable, due to changing needs and objectives. During the course of the investment time horizon, tactical decisions may be made in response to changes in the environment in which one operates. Tactical decisions may stem from changing macroeconomic factors, political landscapes, or thematical views for example. All portfolio management decisions, strategic or tactical, are made with the unique needs and objectives of the investor in mind.

As portfolio managers, we employ an investment process which stems from, and integrates with, our investment philosophy. We attempt to identify opportunities which will be value additive to client portfolios. Once opportunities are identified, they undergo thorough analysis in terms of whether they meet requirements and warrant investment based on each client’s mandate.

Over time, the performance of a strategy is analysed. Although a mandate includes various aspects which, when combined, reflect a risk return profile, performance evaluation most often focuses on return. The most common way of measuring performance is relative to an appropriate benchmark. For the purposes of this newsletter, we have used the MSCI World Index, although there are various indices one could consider.

Performance measurement

When focusing on return, value additive decisions are reflected in a return which “beats” the benchmark. This occurs when asset managers allocate more to an asset that outperforms (relative to the benchmark) or allocate less to an asset which underperforms (relative to the benchmark). It is important to note that the intention is not to outperform the benchmark in each period, but rather to be used as a guide of reasonable performance over time.

When focusing on risk, a successful strategy will be to evaluate the potential of not meeting one’s own investment objectives and needs.

A mandate may also specify an income or growth objective. When evaluating the performance of an investment strategy, it is important to evaluate the investment’s efficacy in meeting these goals as well.

The relationship between risk and return should be considered when analysing the performance of an investment strategy. An investment must be analysed relative to a benchmark which represents the mandate and, even then, the metrics could be misleading. Indices are widely adopted as appropriate benchmarks for performance evaluation. In times of abnormal market behaviour, these indices may be highly concentrated and exhibit levels of volatility (risk) which may not be in line with an investor’s specified risk profile.

Recent performance and volatility of the MSCI World Index exhibits this.

The MSCI World Index

The MSCI World Index is a market capitalisation weighted index, the constituents’ weights fluctuate as their market weights fluctuate. In other words, as a share trades at a higher price, their market capitalisation increases, leading to them representing a larger portion of the index. This is not necessarily a problem if the share is fairly valued and re-rating; but in the instance where it is overvalued, it further inflates the valuation. This problem is exacerbated by passive investors who continue to purchase these companies to maintain their weight in an index tracking portfolio, pushing the price (and weight) up even further.

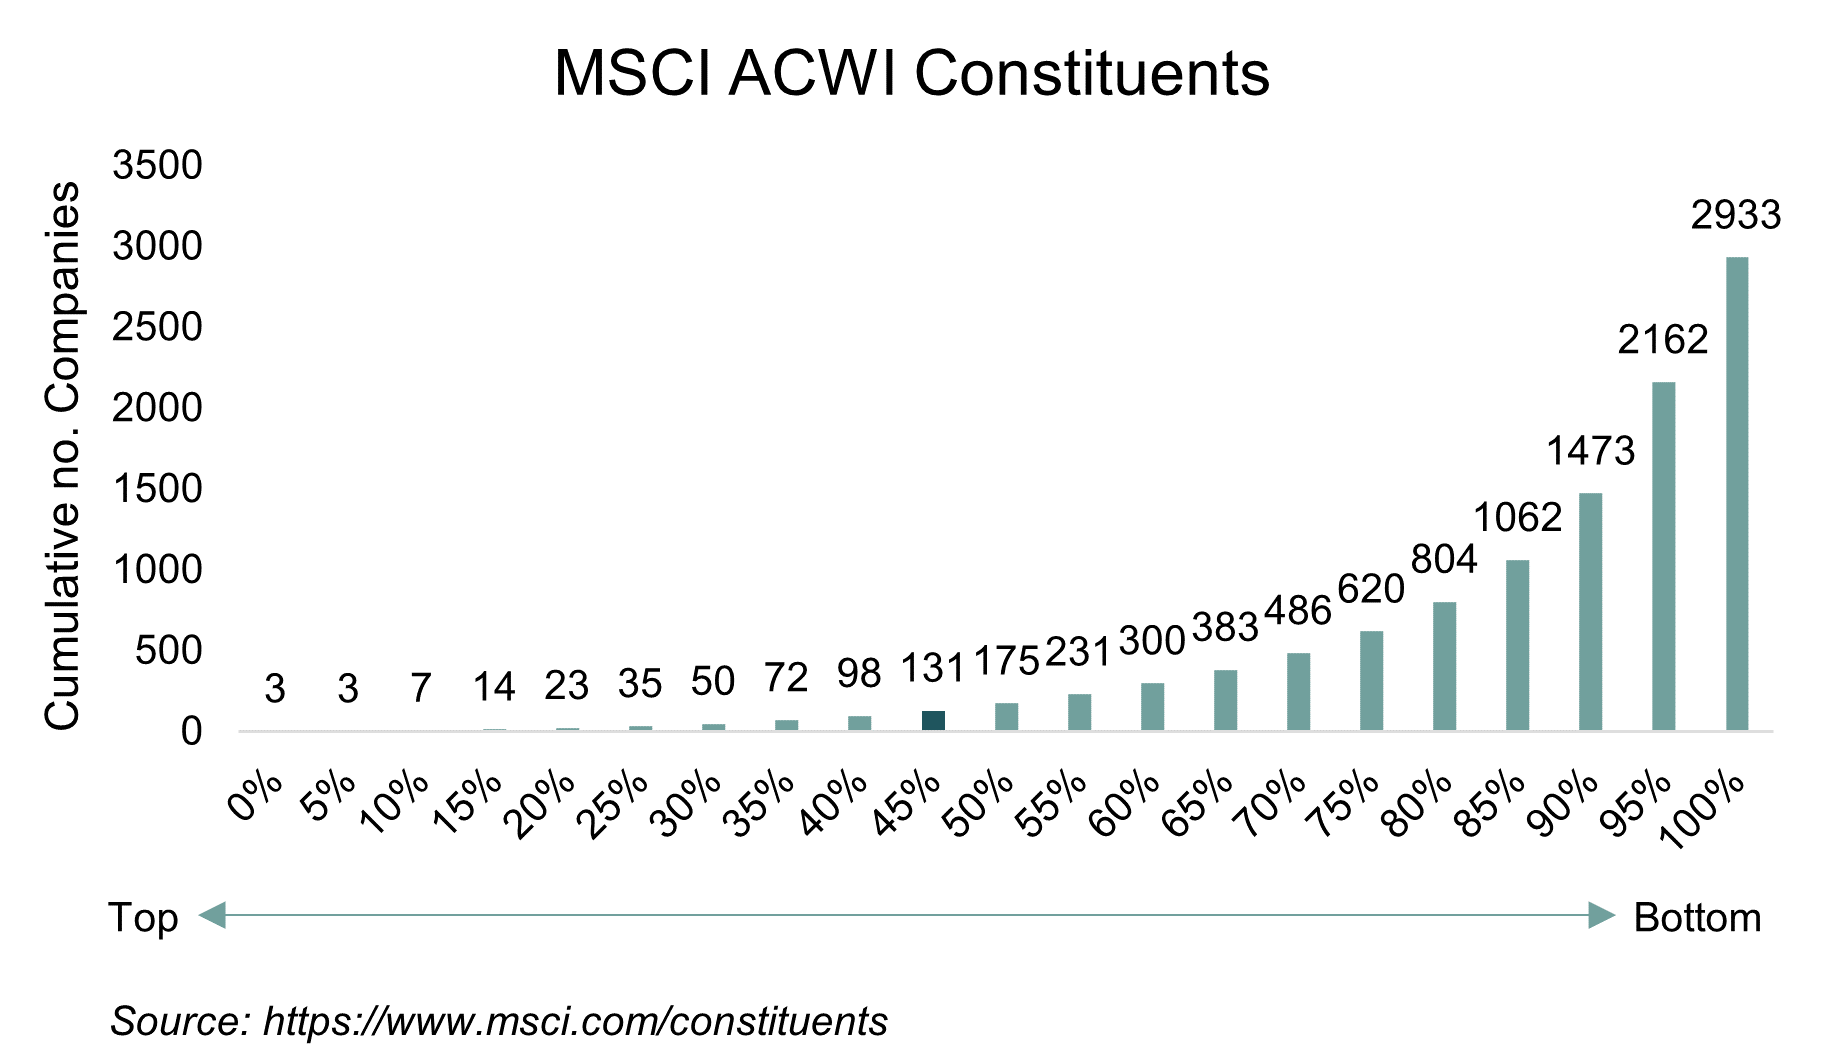
Although there are almost 3,000 constituents in the index, 50% of the index’s value is determined by only 131 companies. In other words, half of the index’s value is influenced by the performance of less than 5% of the constituents. This is exhibited in the graph below. Three companies make up 5% of the index, seven make up 15%, fourteen 20% and so on.

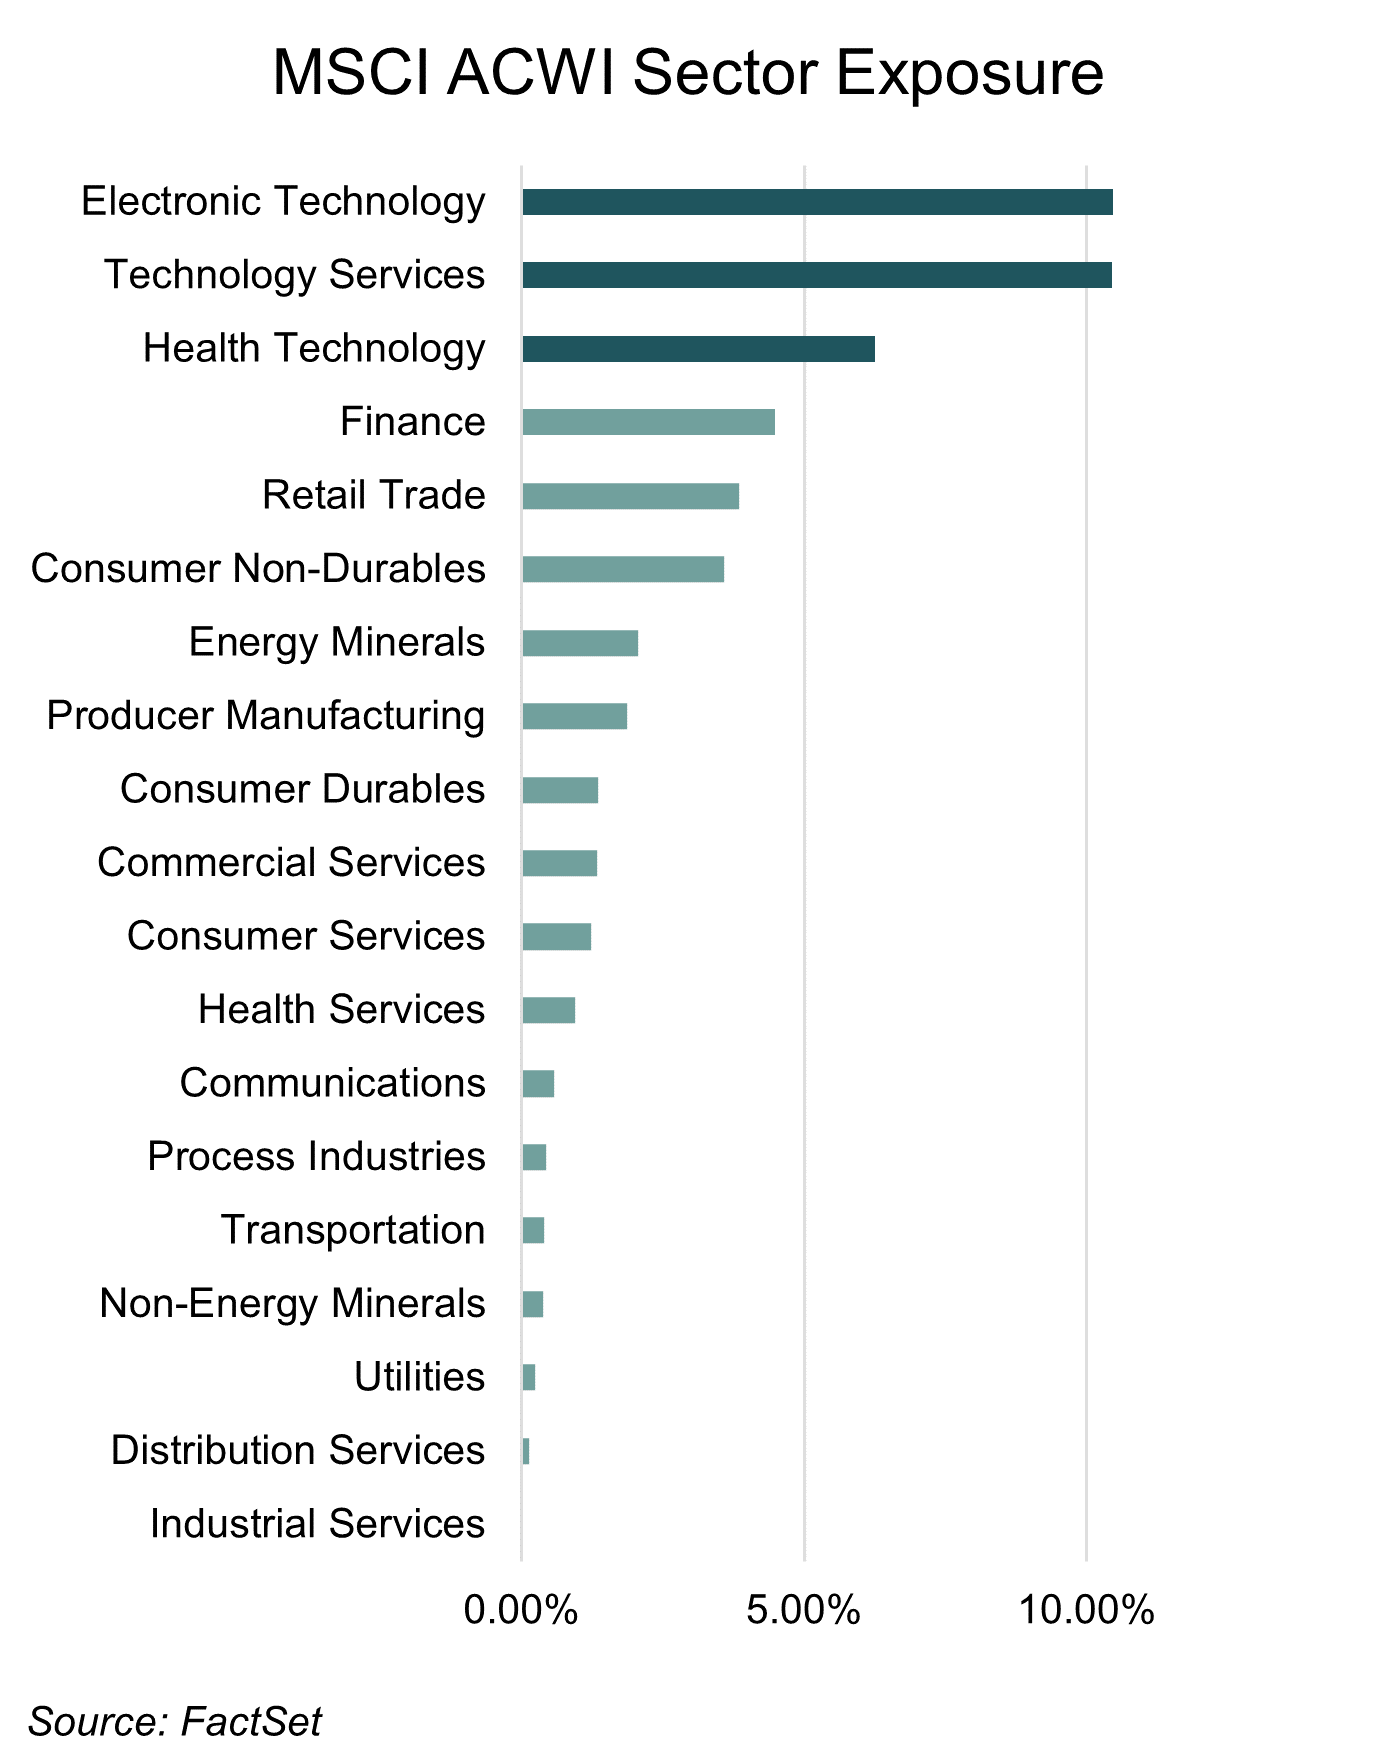
If we analyse the sector composition of the 131 shares that represent 50% of the value of the index in terms of sector composition, around 30% sits in technology and technology related companies.

In terms of effective risk management, one would not invest half of their portfolio in 5% of the constituents or one sector. This would lead to concentration risk and inflate the overall volatility of the portfolio. The MSCI World Index has almost 3,000 constituents, in the average segregated portfolio of 30 to 40 shares, this would equate to investing half of your capital in just 1 to 2 shares.

Although the index represents 99% of the investible global equity market, it is highly concentrated. A diversified portfolio exhibits far less volatility than a concentrated one. Lower volatility translates into smoother returns for investors. In a concentrated portfolio, price movement within the heavily weighted constituents or sectors will dominate returns. While this may be an attractive investment opportunity while the sector is appreciating, the potential downside should not be ignored.

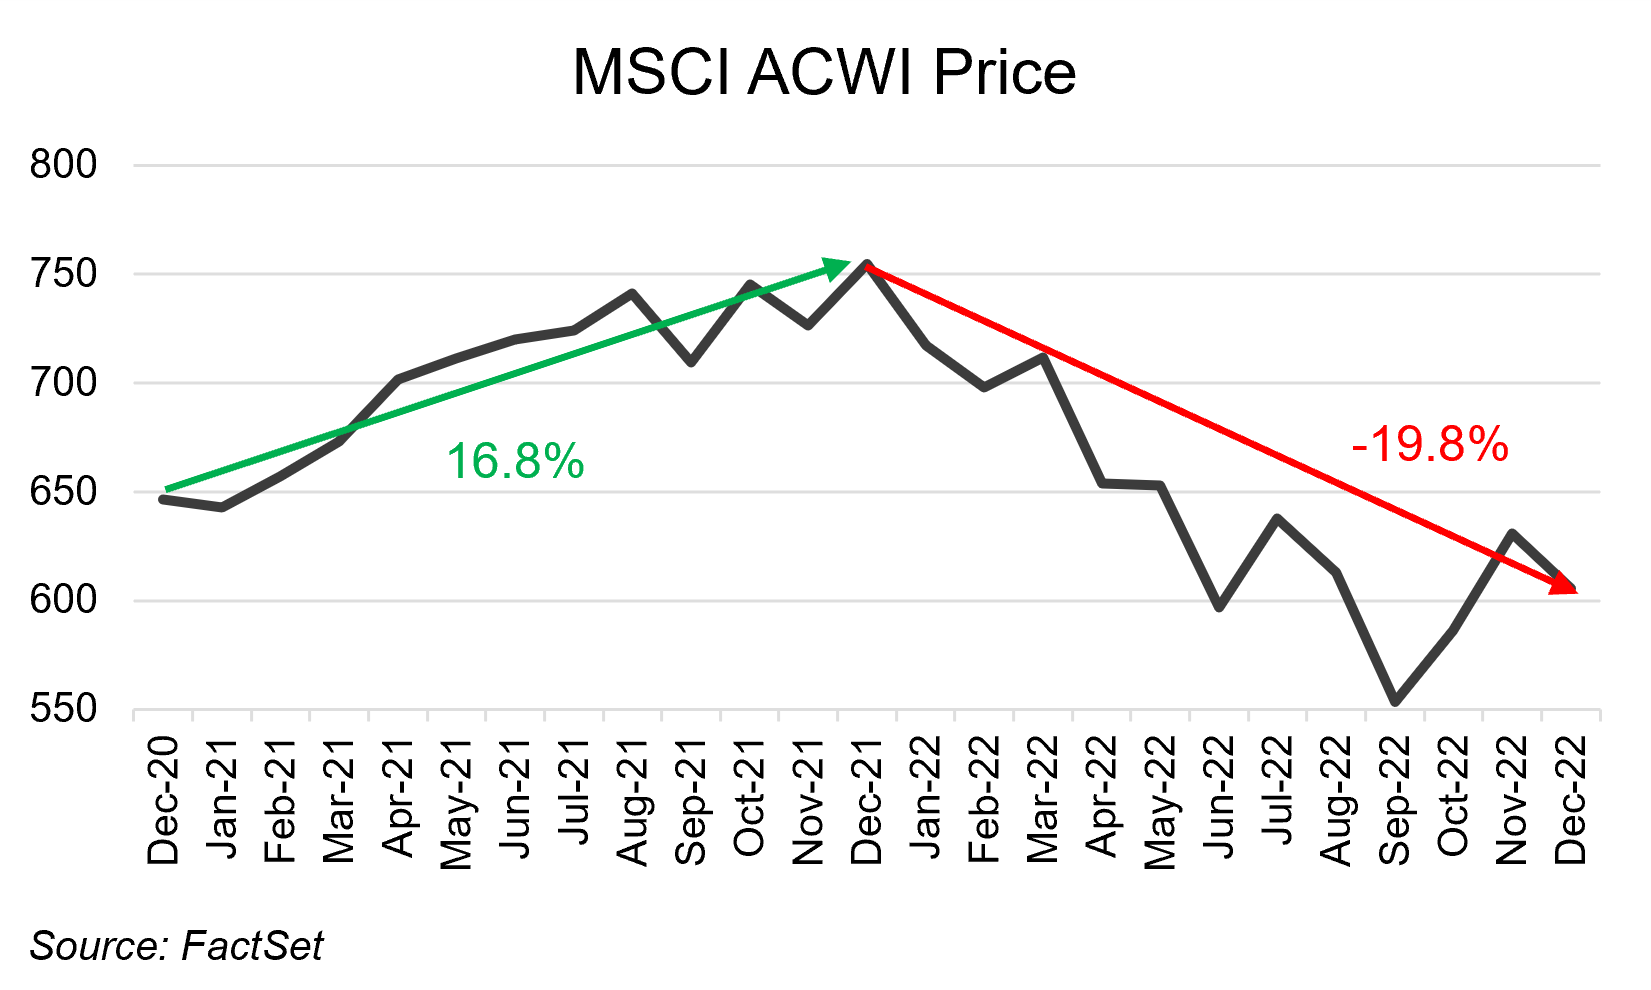
Performance over the 2021 and 2022 calendar years illustrates this concept. 2021 was a positive year for the index, appreciating 16.8%. 2022 however, saw a 19.8% decline.

Although within a diversified portfolio you may not experience the same inflated returns delivered by the prevailing top index performers, your experienced drawdowns will also be muted. A simple calculation shows the impact of volatility on returns, when compared to stable, consistent returns.

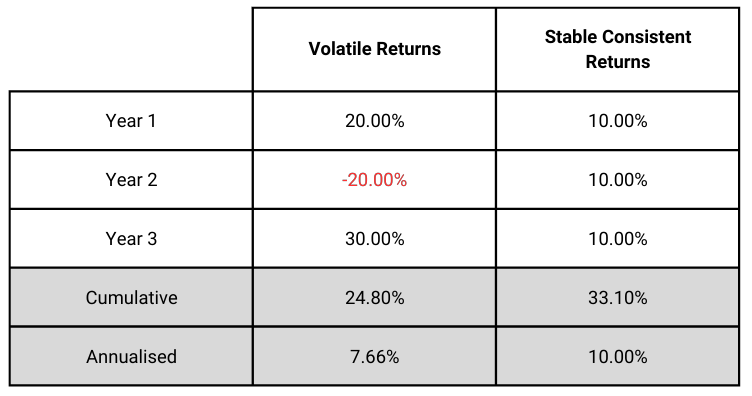
Although the volatile returns in years 1 and 3 were higher than the stable returns, the stable returns were higher over the full period and delivered a more consistent return.

As part of the investment process and resultant portfolio construction, the valuation of a holding is analysed. One of the requirements is that the asset must be priced appropriately. Assets can be value additive if they pay dividends or appreciate in value, or both. If one purchases an asset at a premium, it necessitates higher compensation – either in the form of income or growth.

When assets trade at high valuations compared to their own history or the industry in which they operate, they are relatively overvalued and the risk lies in them de-rating back to normalised levels. This often happens when investors have overestimated their potential growth.

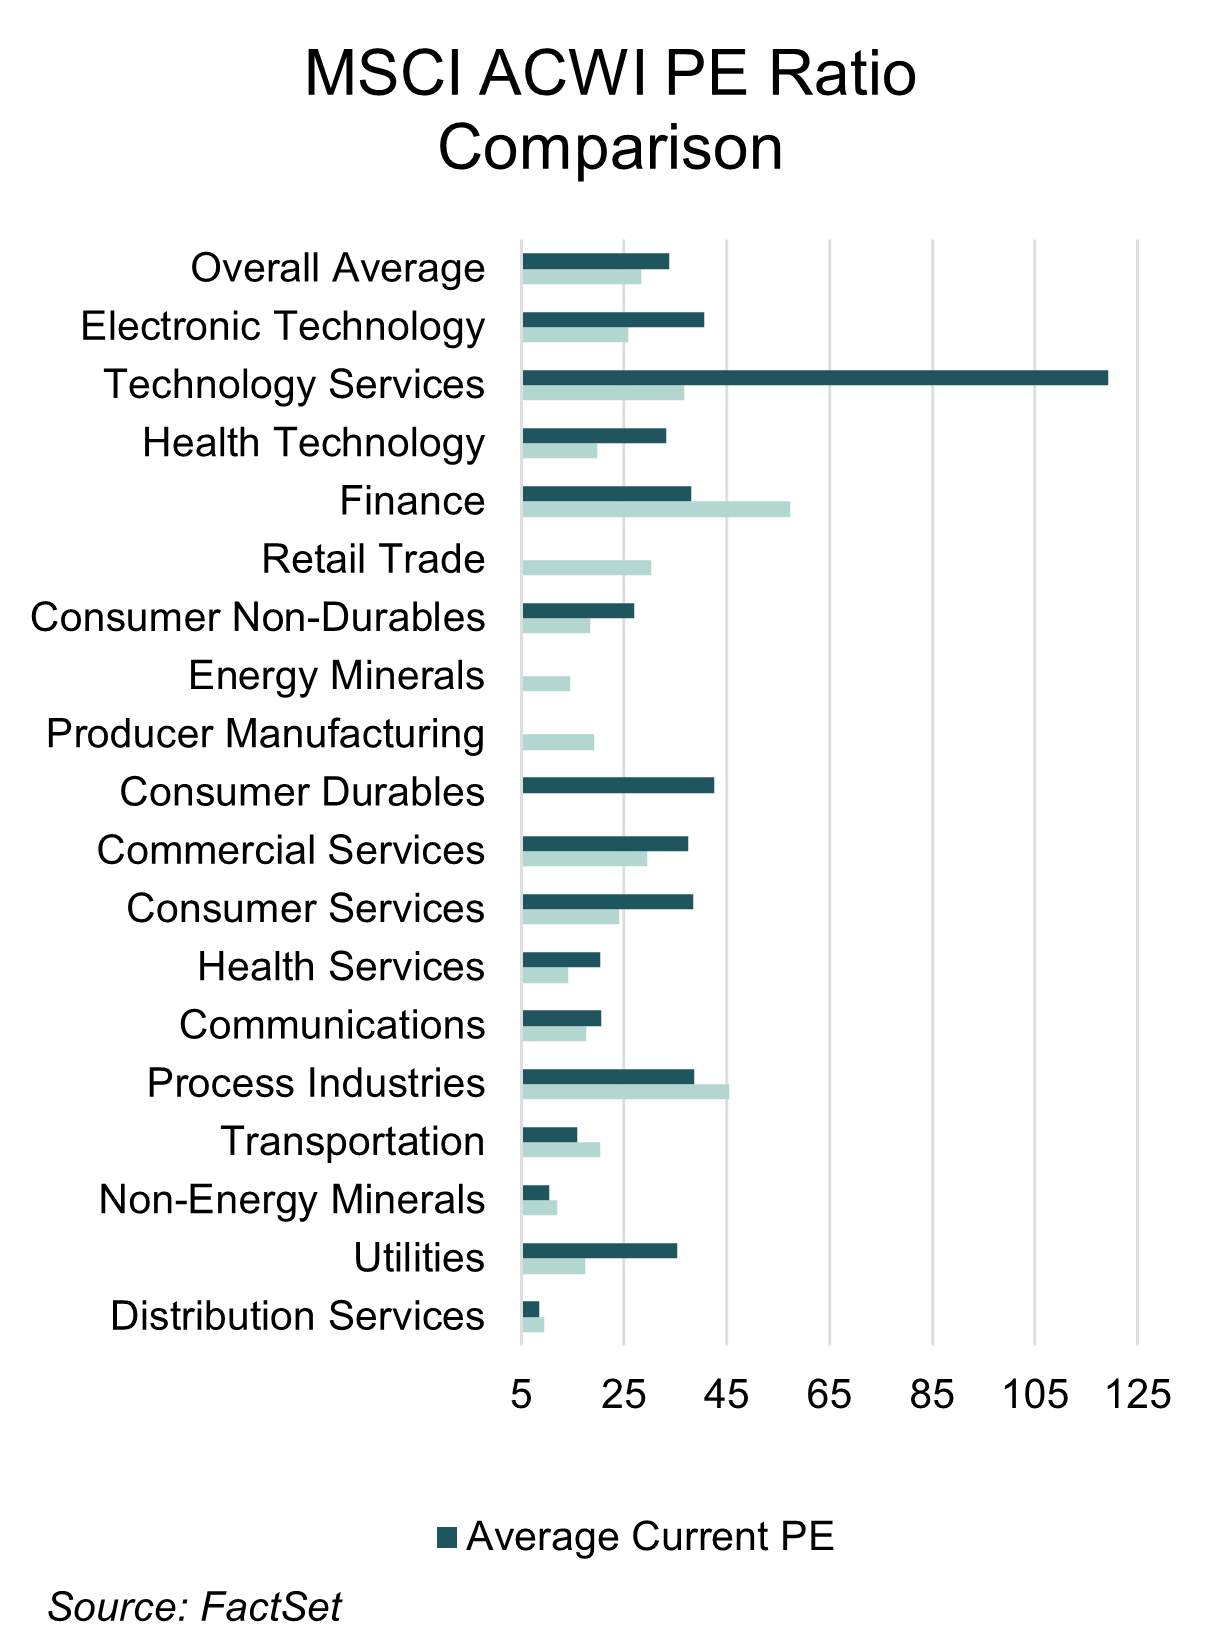
Below is a comparison of the average historical PE ratios of the top 50% of the MSCI World Index’s constituents as well as their current PE ratios. It is additionally important to note that an earnings yield has been used to calculate historical PE ratios to account for years of negative earnings.

It is evident that certain sectors are relatively overvalued compared to their own 20 year historical average. The average historical PE ratio of the top 50% of the index’s constituents is around 28.3x, it currently sits at 33.8x. The top 3 sectors are all trading at, or above, the current overall average, as well as above their own historical averages.

Given these high multiples, investors would expect to benefit from either price appreciation or a lucrative income stream (in the form of dividends). If they do not, the shares will eventually de-rate. Consumer Services and Commercial Services constituents have shown the greatest annualised price performance (growth); and Communications and Energy Minerals had the highest dividend yields (income) over the past 20 years.

Those sectors with proven track records of delivering returns, either in the form of price appreciation, income generation, or both, are underrepresented within the index. Those sectors trading at multiples well above historical averages, and therefore considered expensive, are over represented.

Keep focus on the end goal

Not only is the MSCI World Index concentrated in 5% of the constituents and heavily weighted towards technology and technology related sectors, it is also trading at an inflated PE ratio and stands the risk of derating back to normalised levels. These risks highlight the importance of effective risk management within an investment portfolio.

In the case where performance is measured against a benchmark, it is imperative to employ an appropriate benchmark, based on one’s unique objectives. In terms of effective risk management, one must remain well-diversified, especially in times of abnormal market behaviour. Although you won’t be immune to broad market declines, your downside participation should be muted when appropriate risk management efforts are employed.

As investors, it is important to focus on returns over your specific investment horizon. Short-term deviations from the benchmark are expected for longer-term investment horizons. When one underperforms, it is important to look at the reasons why. If it is due to the comparative benchmark being concentrated in a sector or an asset which you have less exposure to, you may well be appropriately positioned to protect capital in the case of a derating. The compounding of consistent returns leads to a better result over the long-term.

View the August 2023 market summary

View
Categories
1 Comment

Comments are closed.

Privacy Settings
We use cookies to enhance your experience while using our website. If you are using our Services via a browser you can restrict, block or remove cookies through your web browser settings. We also use content and scripts from third parties that may use tracking technologies. You can selectively provide your consent below to allow such third party embeds. For complete information about the cookies we use, data we collect and how we process them, please read our Privacy Policy
Youtube
Consent to display content from - Youtube
Vimeo
Consent to display content from - Vimeo
Google Maps
Consent to display content from - Google
Spotify
Consent to display content from - Spotify
Sound Cloud
Consent to display content from - Sound