In last month’s newsletter, we discussed the MSCI World Index’s composition. We investigated its appropriateness, as a market capitalisation weighted index, as a benchmark and whether it would be sensible to invest a direct share portfolio in a similar fashion.
In this newsletter, we will continue looking at the MSCI World Index (MSCI WI). The purpose of this analysis is to gain insight into the behaviour of the largest companies in the index relative to the others and to highlight potential risks.
To facilitate the analysis, we have compared the index against itself, according to different weighting methodologies. The first version of the index is the MSCI WI, weighted by market capitalisation (MCW), and the second is the MSCI WI, equally weighted (EQW). The latter is rebalanced quarterly. These two indices consist of the same constituents (1,513 companies as of September 2023). Together, they cover 85% of the global investable equity universe.
Consequently, the returns in the MCW will be largely driven by the largest companies, whereas the EQW will have approximately equal contributions by all companies in the index.
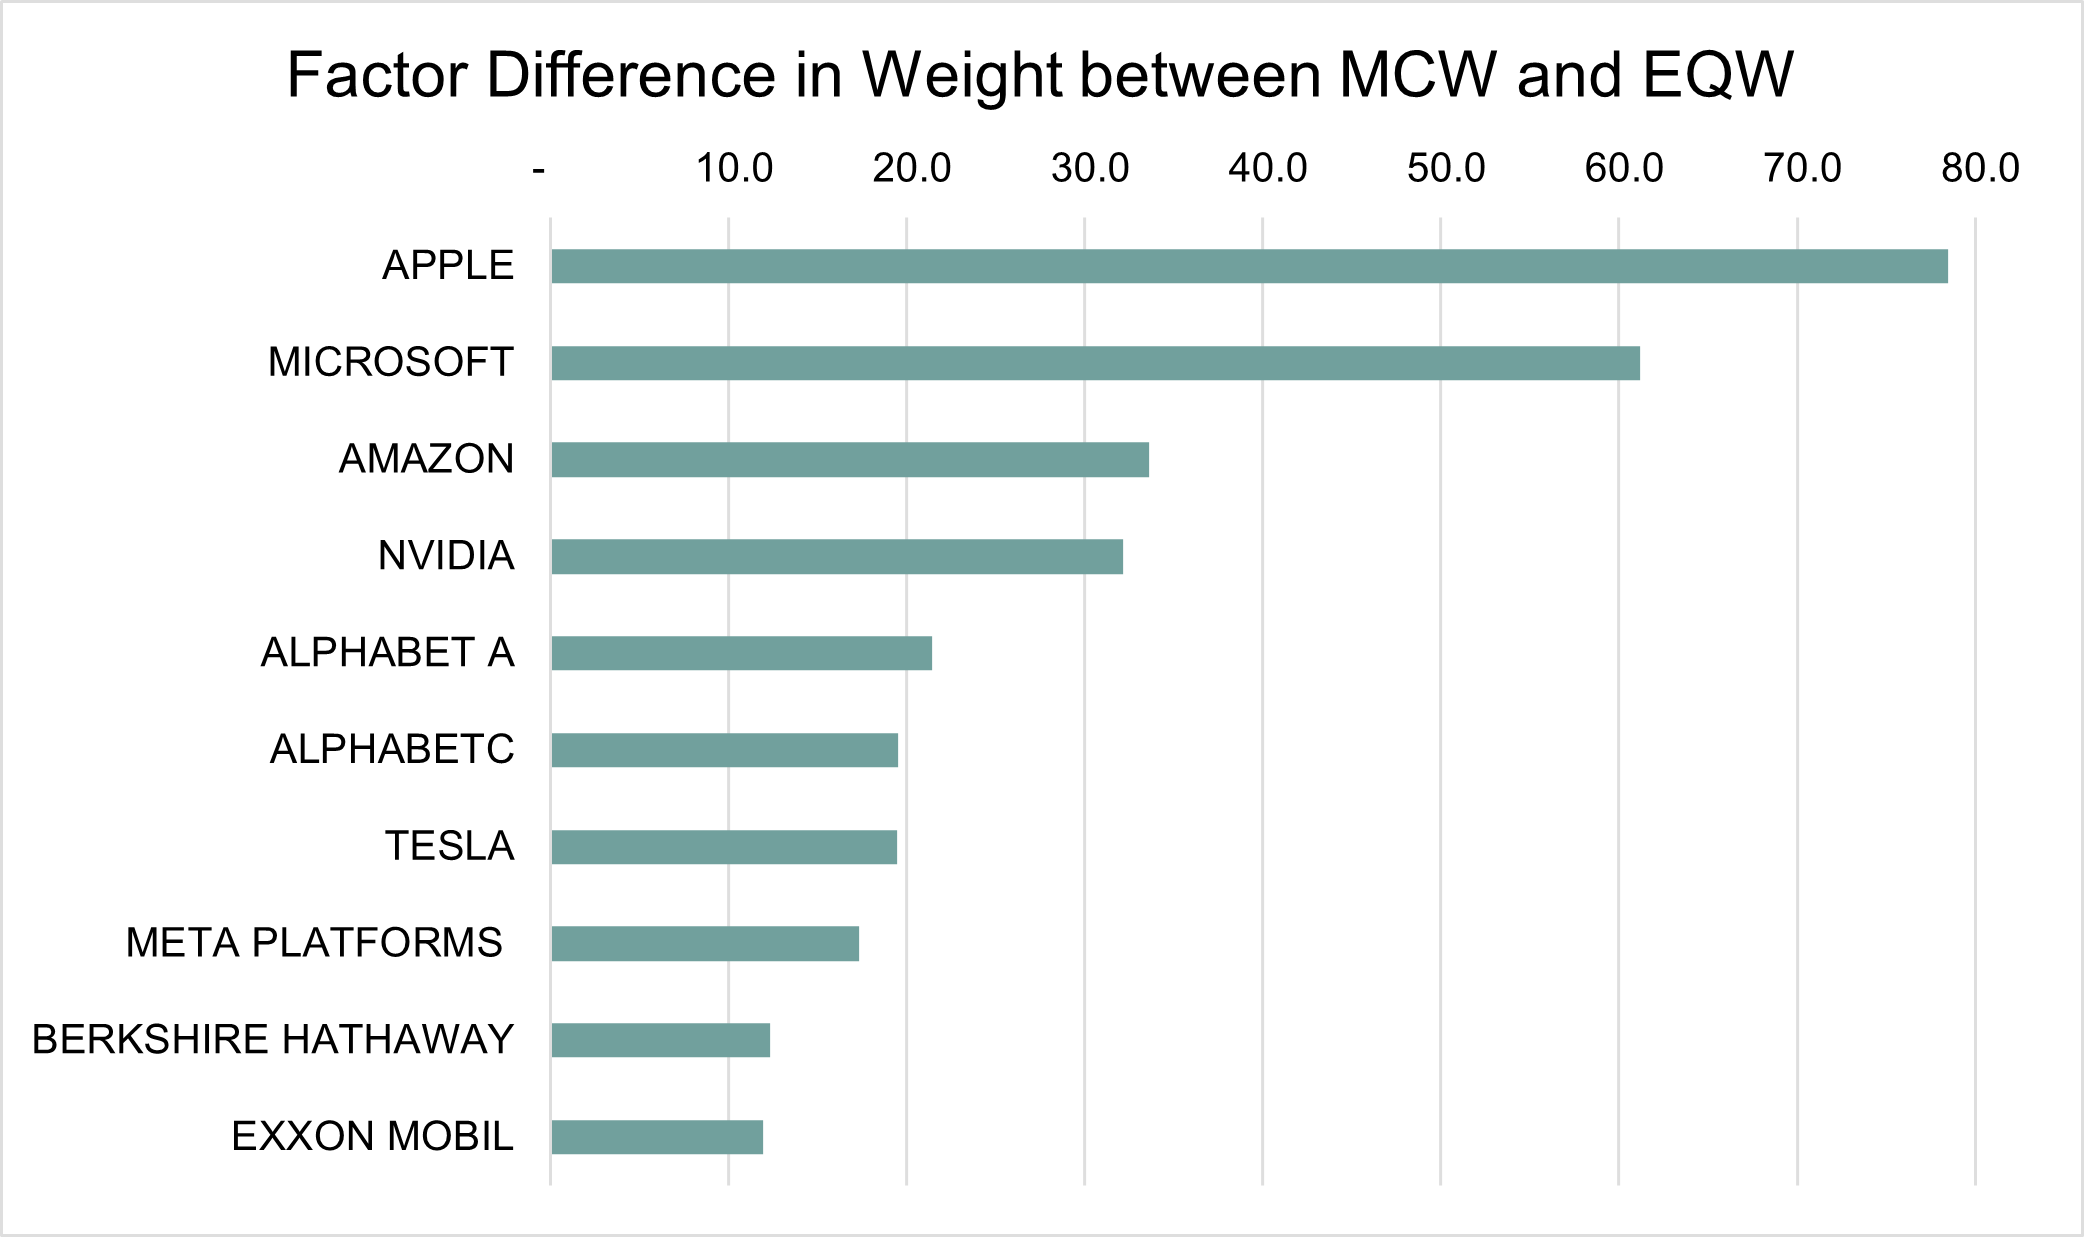
As an example: at present, Apple is the company with the largest market capitalisation at almost 2.7 trillion US dollars. Within the MCW Index, it carries a weight of 5.2%, but in the EQW Index it will only have a weight of 1/1,513 or 0.066% (6.6 basis points). In other words, the weight of Apple is greater by a factor of 78.5 times in the MCW, when compared to the EQW.

The ten largest companies are shown in Figure 1, comparing their respective weights in the MCW Index relative to the EQW Index.
Figure 1
When will the MCW outperform EQW?
When the largest companies in the world outperform the general market, the MCW Index will outperform. In contrast, when the general market fares better than the biggest companies, it will lead to outperformance of the EQW Index. Rebalancing also plays a role, as described in the note at the end.
“Do the biggest companies in the world outperform the general market on average?”
Figure 2 shows the hypothetical value of USD 1 invested in each of the indices, from September 1973 to present.
Figure 2
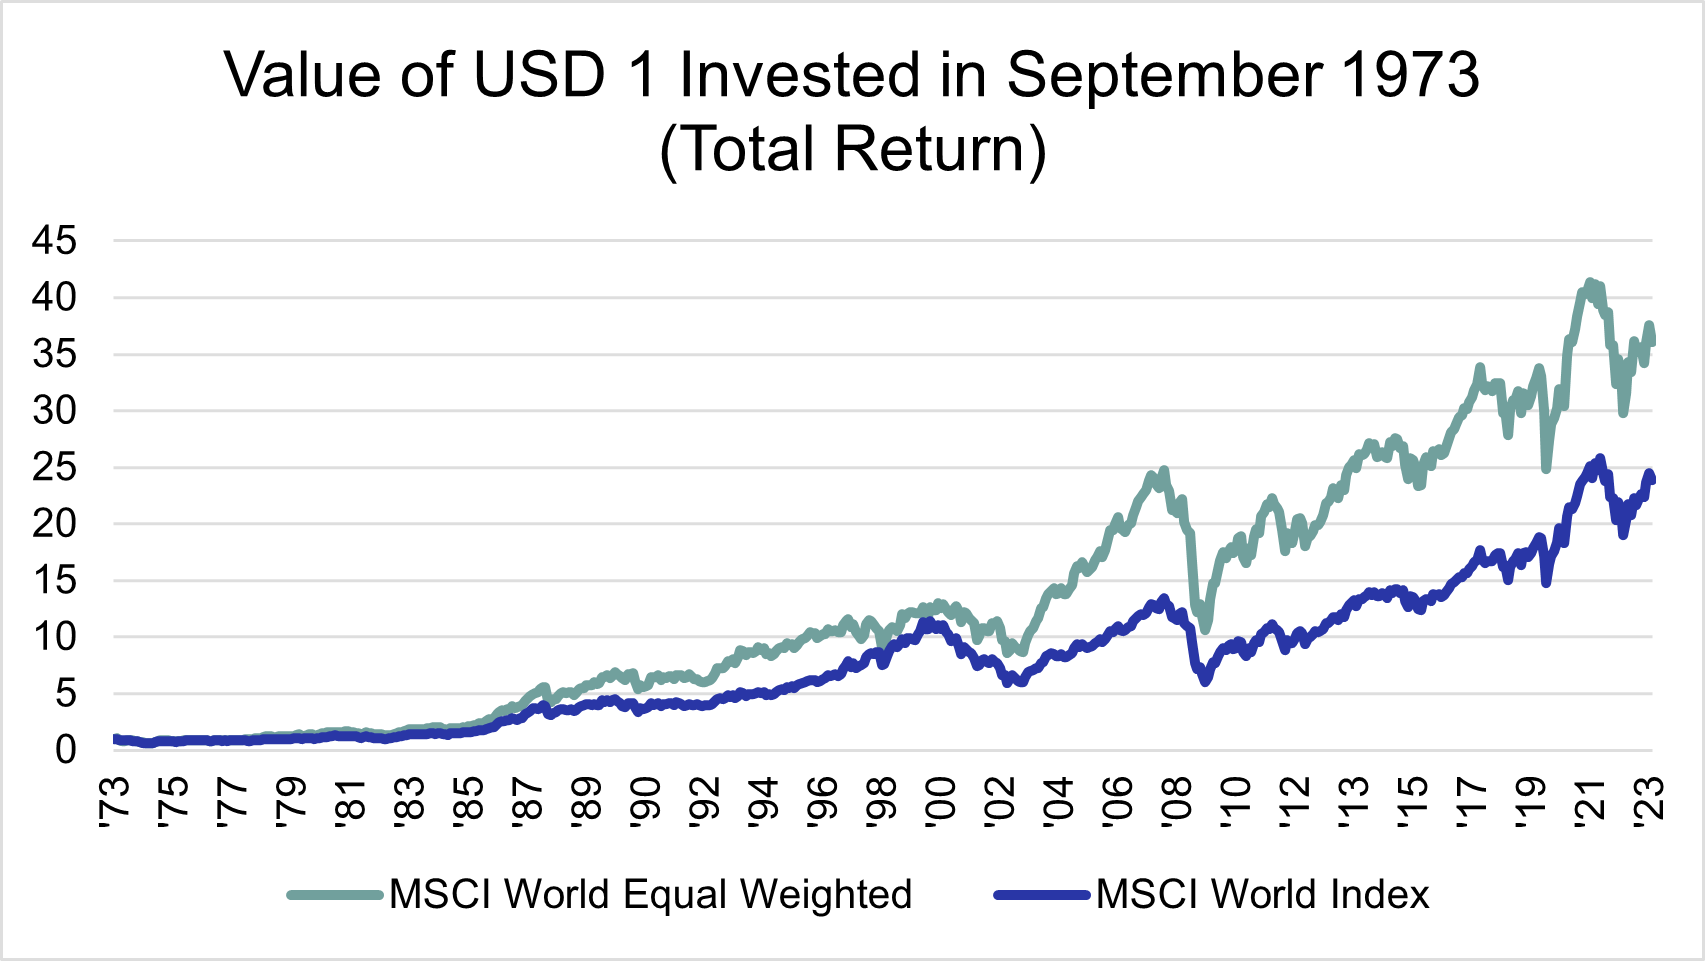
As you can see, although the general direction of these two indices tends to be the same, the EQW Index has outperformed the MCW Index over the period.
Table 1

If we delve deeper, we can learn more about the dynamic of the largest companies’ investment returns relative to the general market.
Figure 3 shows the relative performance of the EQW Index versus the MCW Index.
Figure 3
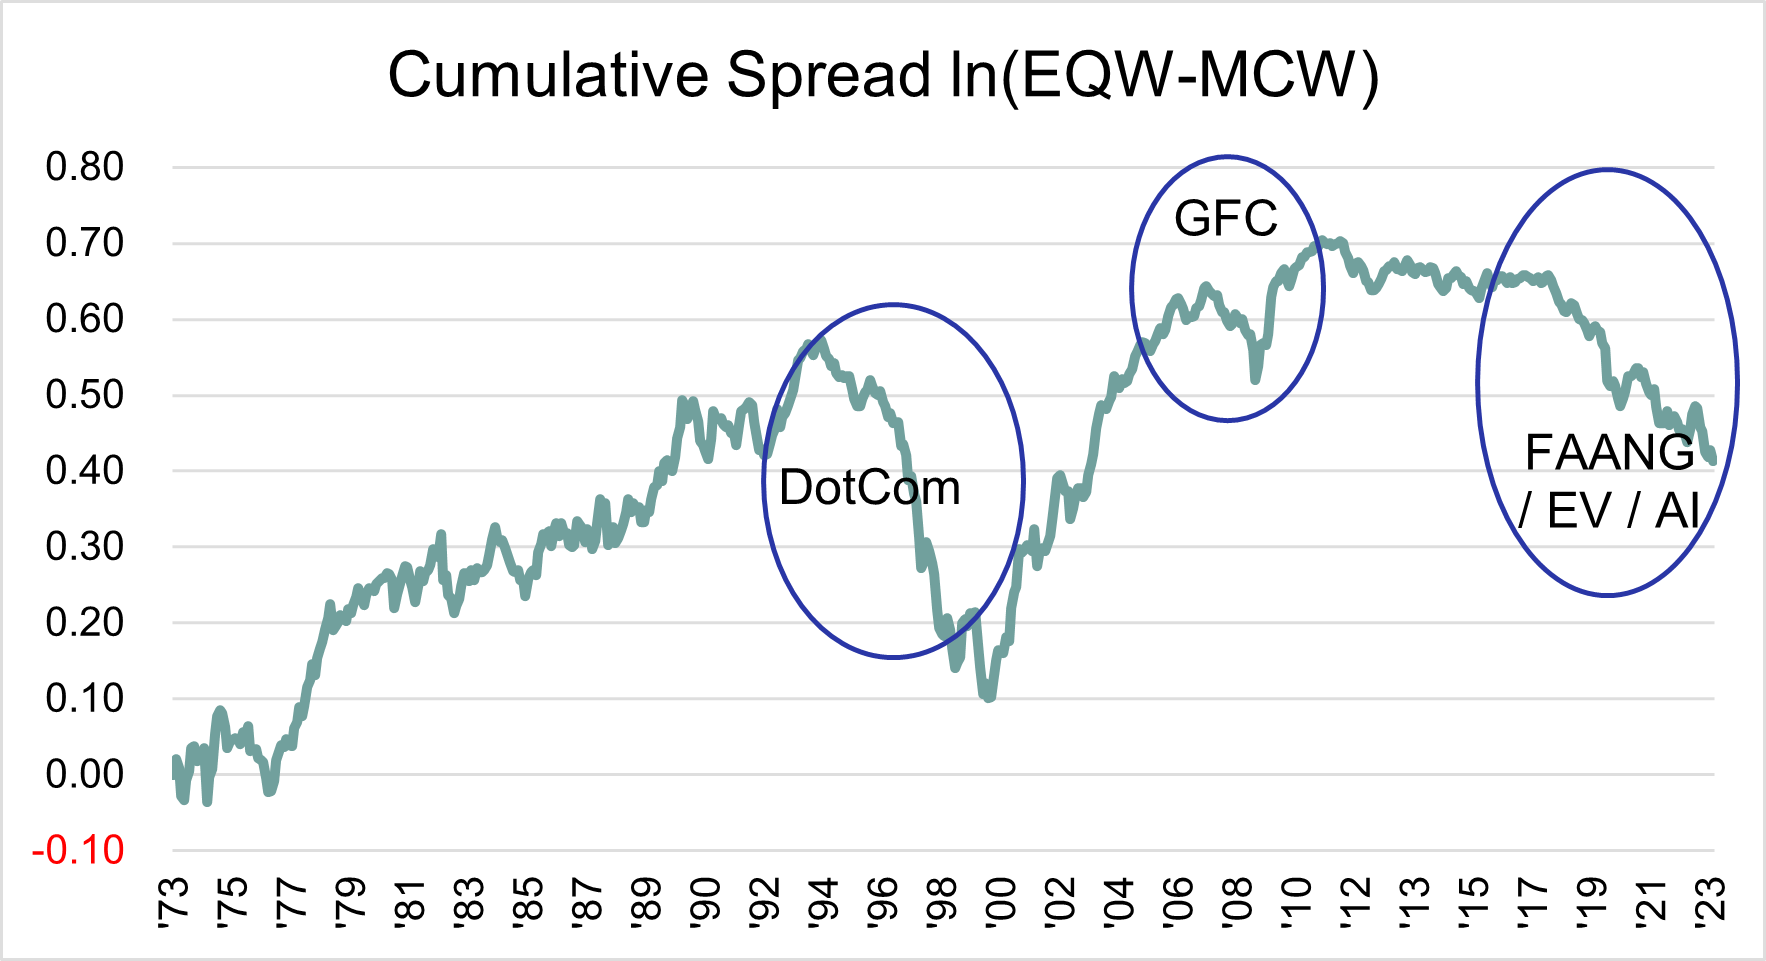
When the line in Figure 3 moves up (positive), it represent periods where the EQW Index outperforms the MCW Index and vice versa. Three areas of particular interest are highlighted. These are periods where the MCW Index outperformed the EQW Index. The first was the period in the run-up to the DotCom bubble, the second was the period around the Great Financial Crisis (GFC) and the last, the current period of Tech domination.
Historically, these phases can last for several years. The trend might even be intensified in the winner-takes-all modern economy. One could argue however, that it would be extremely difficult for just a handful of companies to perpetually outperform all other companies, especially if they are clustered within the same sectors.
For the past 12 years, the MCW Index has been outperforming the EQW Index (as can be seen by the recent downward trend in Figure 3). As we know, the theme supporting these dominating companies (the so called Magnificent Seven) has been FAANG (Facebook or Meta, Amazon, Apple, Netflix and Google or Alphabet), Electric Vehicles (Tesla) and Artificial Intelligence (Nvidia).
Difference in exposure
In Figure 4, the factor difference in weights between the MCW Index and the EQW Index per sector is shown. It is similar to Figure 1, but for sectors instead of individual shares.

Figure 4
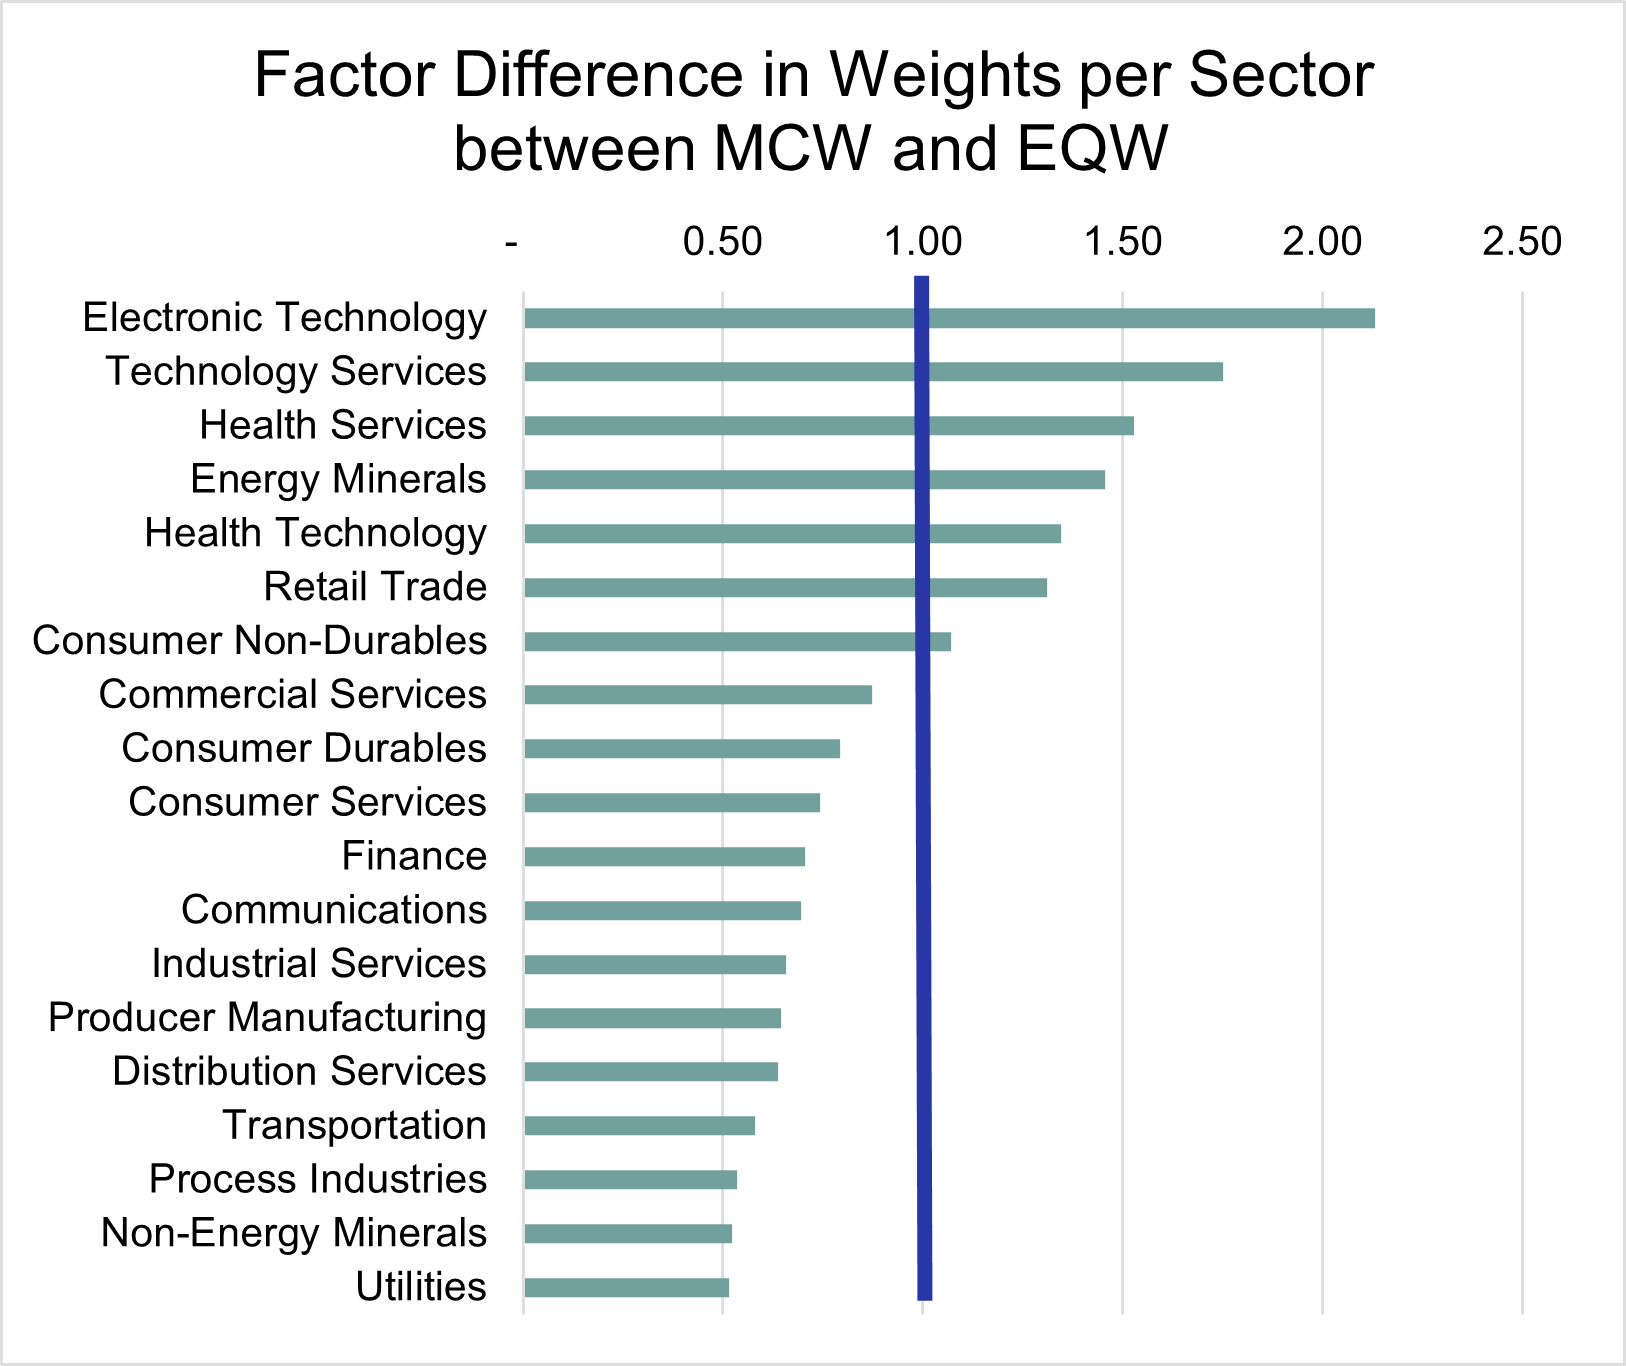
Figure 4 summarizes the difference in exposure between the two indices. Wherever the factor difference is greater than one, the MCW Index will out (under) perform for a positive (negative) sector return. The opposite will hold for weights smaller than one.
The exposure to Electronic Technology and Technology Services is far greater in the MCW Index compared to the EQW Index.
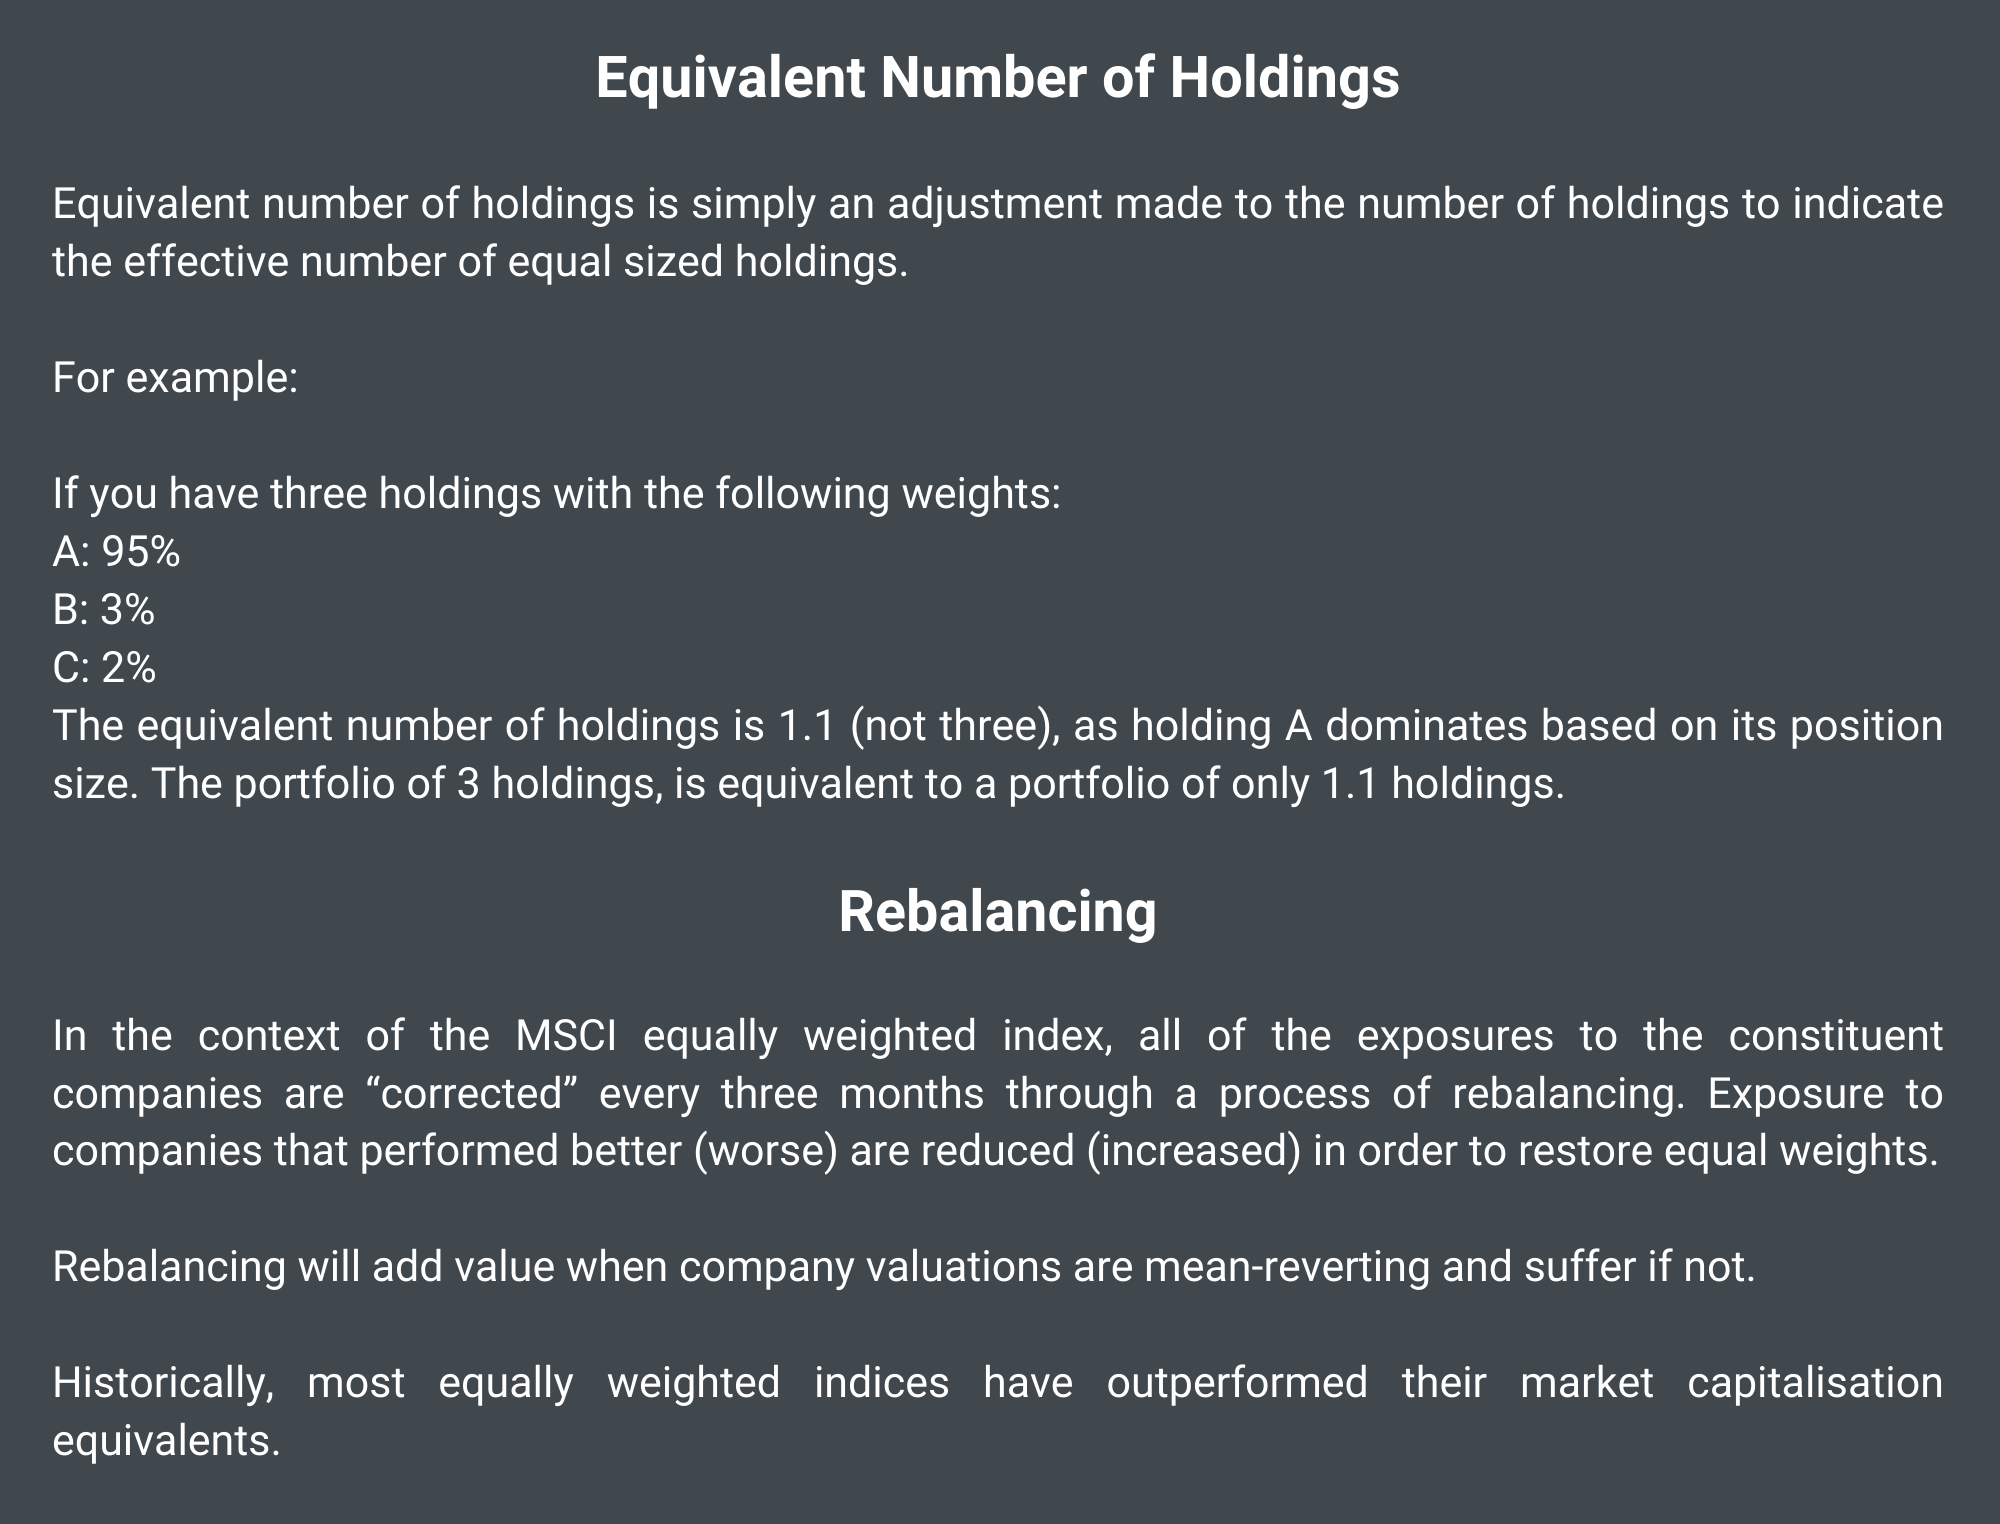
Concentration
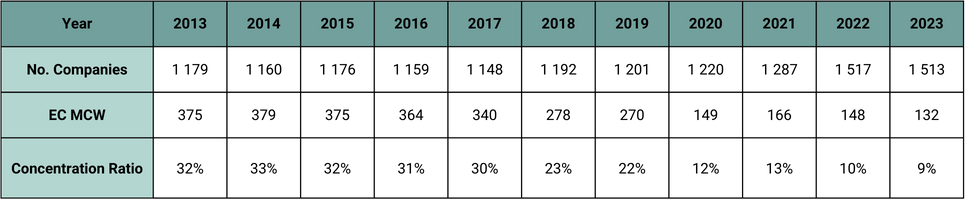
To further evaluate the concentration of the weights in the MCW Index, we compare the equivalent number of companies in the MCW Index (EC MWC) to the number of constituent companies in the index over the past 10 years.
Table 2

To put the results into words:
If you invested in:
2013
- in the EQW Index, your exposure would be spread evenly across 1,179 companies; while
- in the MCW Index, your exposure would be spread across effectively 375
2023
- in the EQW Index your exposure would be spread evenly across 1,513 companies; while
- in the MCW Index your exposure would be spread across effectively 132
Even though there are more companies in the MSCI World Index today, relative to ten years ago, the weights of the largest companies within the MCW Index have increased over this period. This has led to the effective exposure being concentrated in less companies than before.
Figure 5 shows the concentration ratio calculated in Table 2.
Figure 5
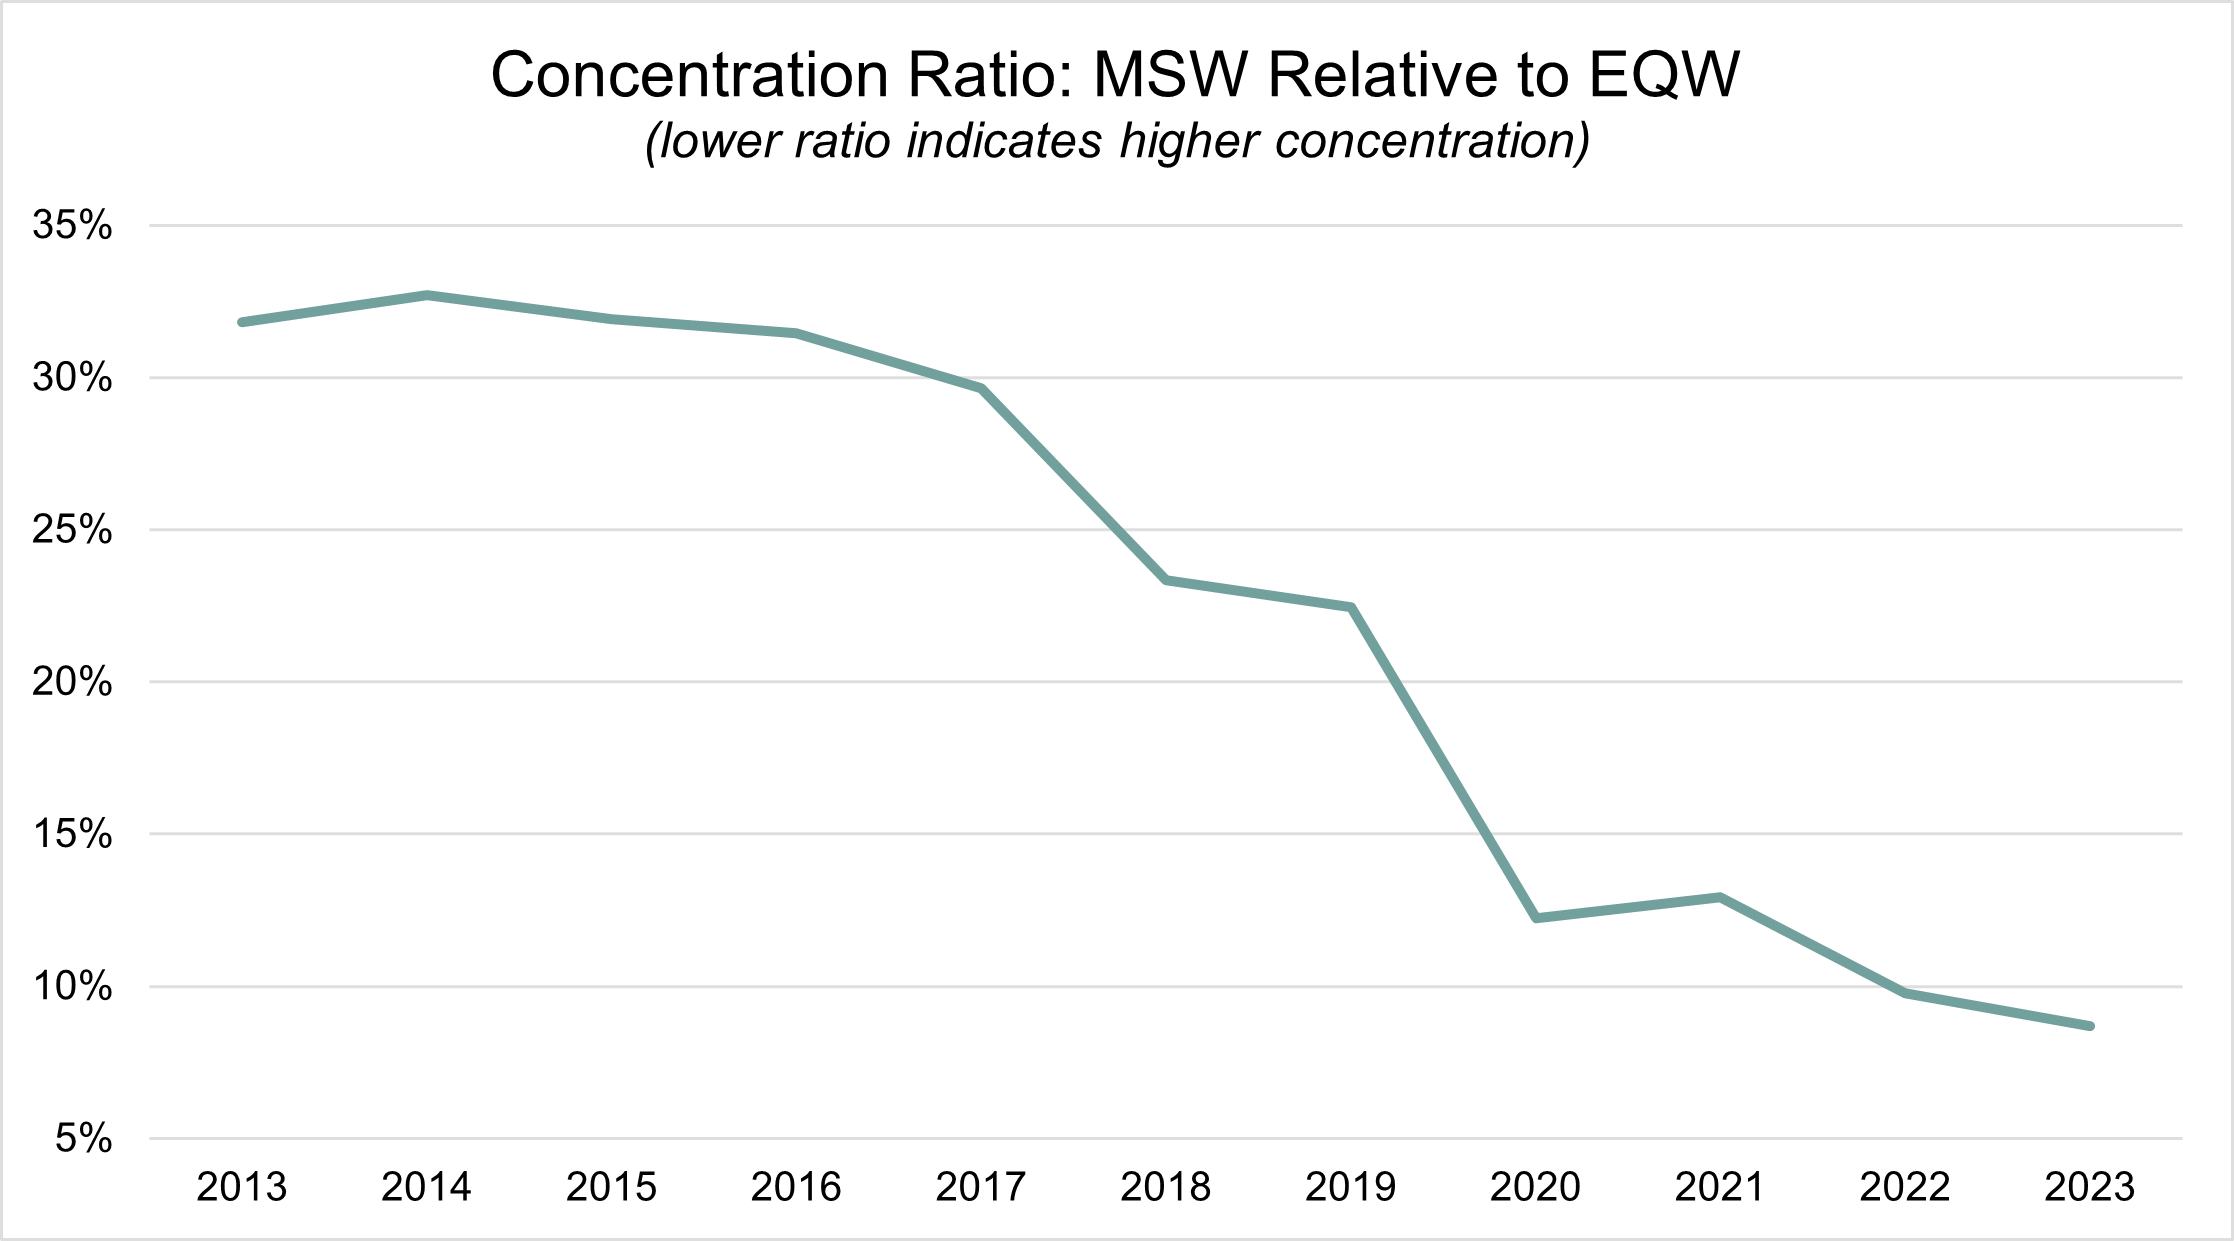
Over the past ten years, the investment returns of the general market were dominated by just a handful of companies – raising questions around the sustainability of this trend and the potential risks for investors using market capitalisation weighted exchange traded funds. Historically, one can argue that the outperformance of large companies has been a leading indicator of inflated valuations amongst these companies.
Keeping a cool head and paying attention to valuation will always be a rational approach to investing. Over the short to medium term, some popular investment approaches might tempt you to change course, but herein lies the challenge. Do you want to provide capital to businesses that offer tangible value, or businesses that you hope other people will buy.