Money Supply as a leading indicator of company earnings
What is Money Supply?
Money supply refers to the total amount of money available in an economy, at a particular time. It includes cash, coins, balances in checking and savings accounts, and other liquid financial instruments. It is a key factor in determining inflation, interest rates, and economic growth. There are different measures of money supply as outlined below.
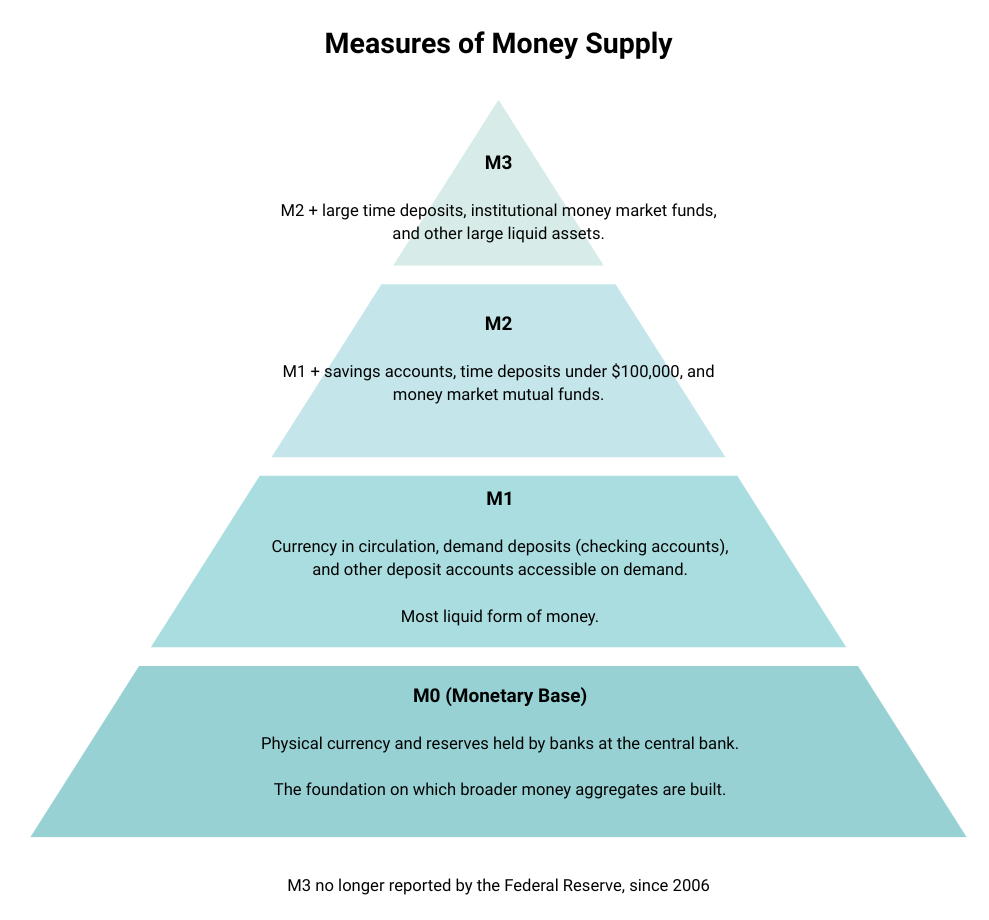
How Money Supply Changes
Money supply can be manipulated by central banks. There are two ways to do so, either through changing interest rates, or by buying or selling government bonds. These mechanisms are referred to as Monetary Policy.
Monetary Policy Mechanisms
- Federal Funds Rate (Interest Rate Policy):
- The Fed Funds Rate is the interest rate at which banks lend reserves to each other overnight.
- Lowering the rate makes borrowing cheaper, which incentivises borrowing. As banks lend more → money supply increases.
- Raising the rate makes borrowing more expensive, which disincentivises borrowing. As banks lend less → money supply decreases.
- Open Market Operations (OMO):
- Buying Government Bonds:
- The Fed buys bonds from banks. As banks receive money, they have more reserves available for lending. As banks lend more → money supply increases.
- Selling Government Bonds:
- The Fed sells bonds to banks or investors. As money flows to the Fed, bank reserves shrink → money supply decreases.
Why Adjust the Money Supply?
Central banks utilise money supply as a tool to influence the economy, they employ the mechanisms highlighted above to either fight inflation or stimulate the economy.
- To combat inflation:
- If prices are rising too fast, the Fed reduces the money supply (via higher interest rates or selling bonds) to cool demand.
- To stimulate the economy:
- During periods of slow or negative growth, the Fed increases the money supply (via lower rates or buying bonds) to boost spending and investment.
When central banks increase money supply, they do so to stimulate the economy.
- Higher Money Supply:
- More money in the system → easier credit → increased consumer spending → businesses sell more → higher revenues and profits → higher earnings.
- If the increase in money supply chases stocks, real estate, or commodities instead of goods / services, asset prices can rise disproportionately.
The historic relationship between US money supply and company earnings
The graph below shows the US money supply (M2) from 1959 to 2025. It also shows the earnings of companies in the S&P 500.
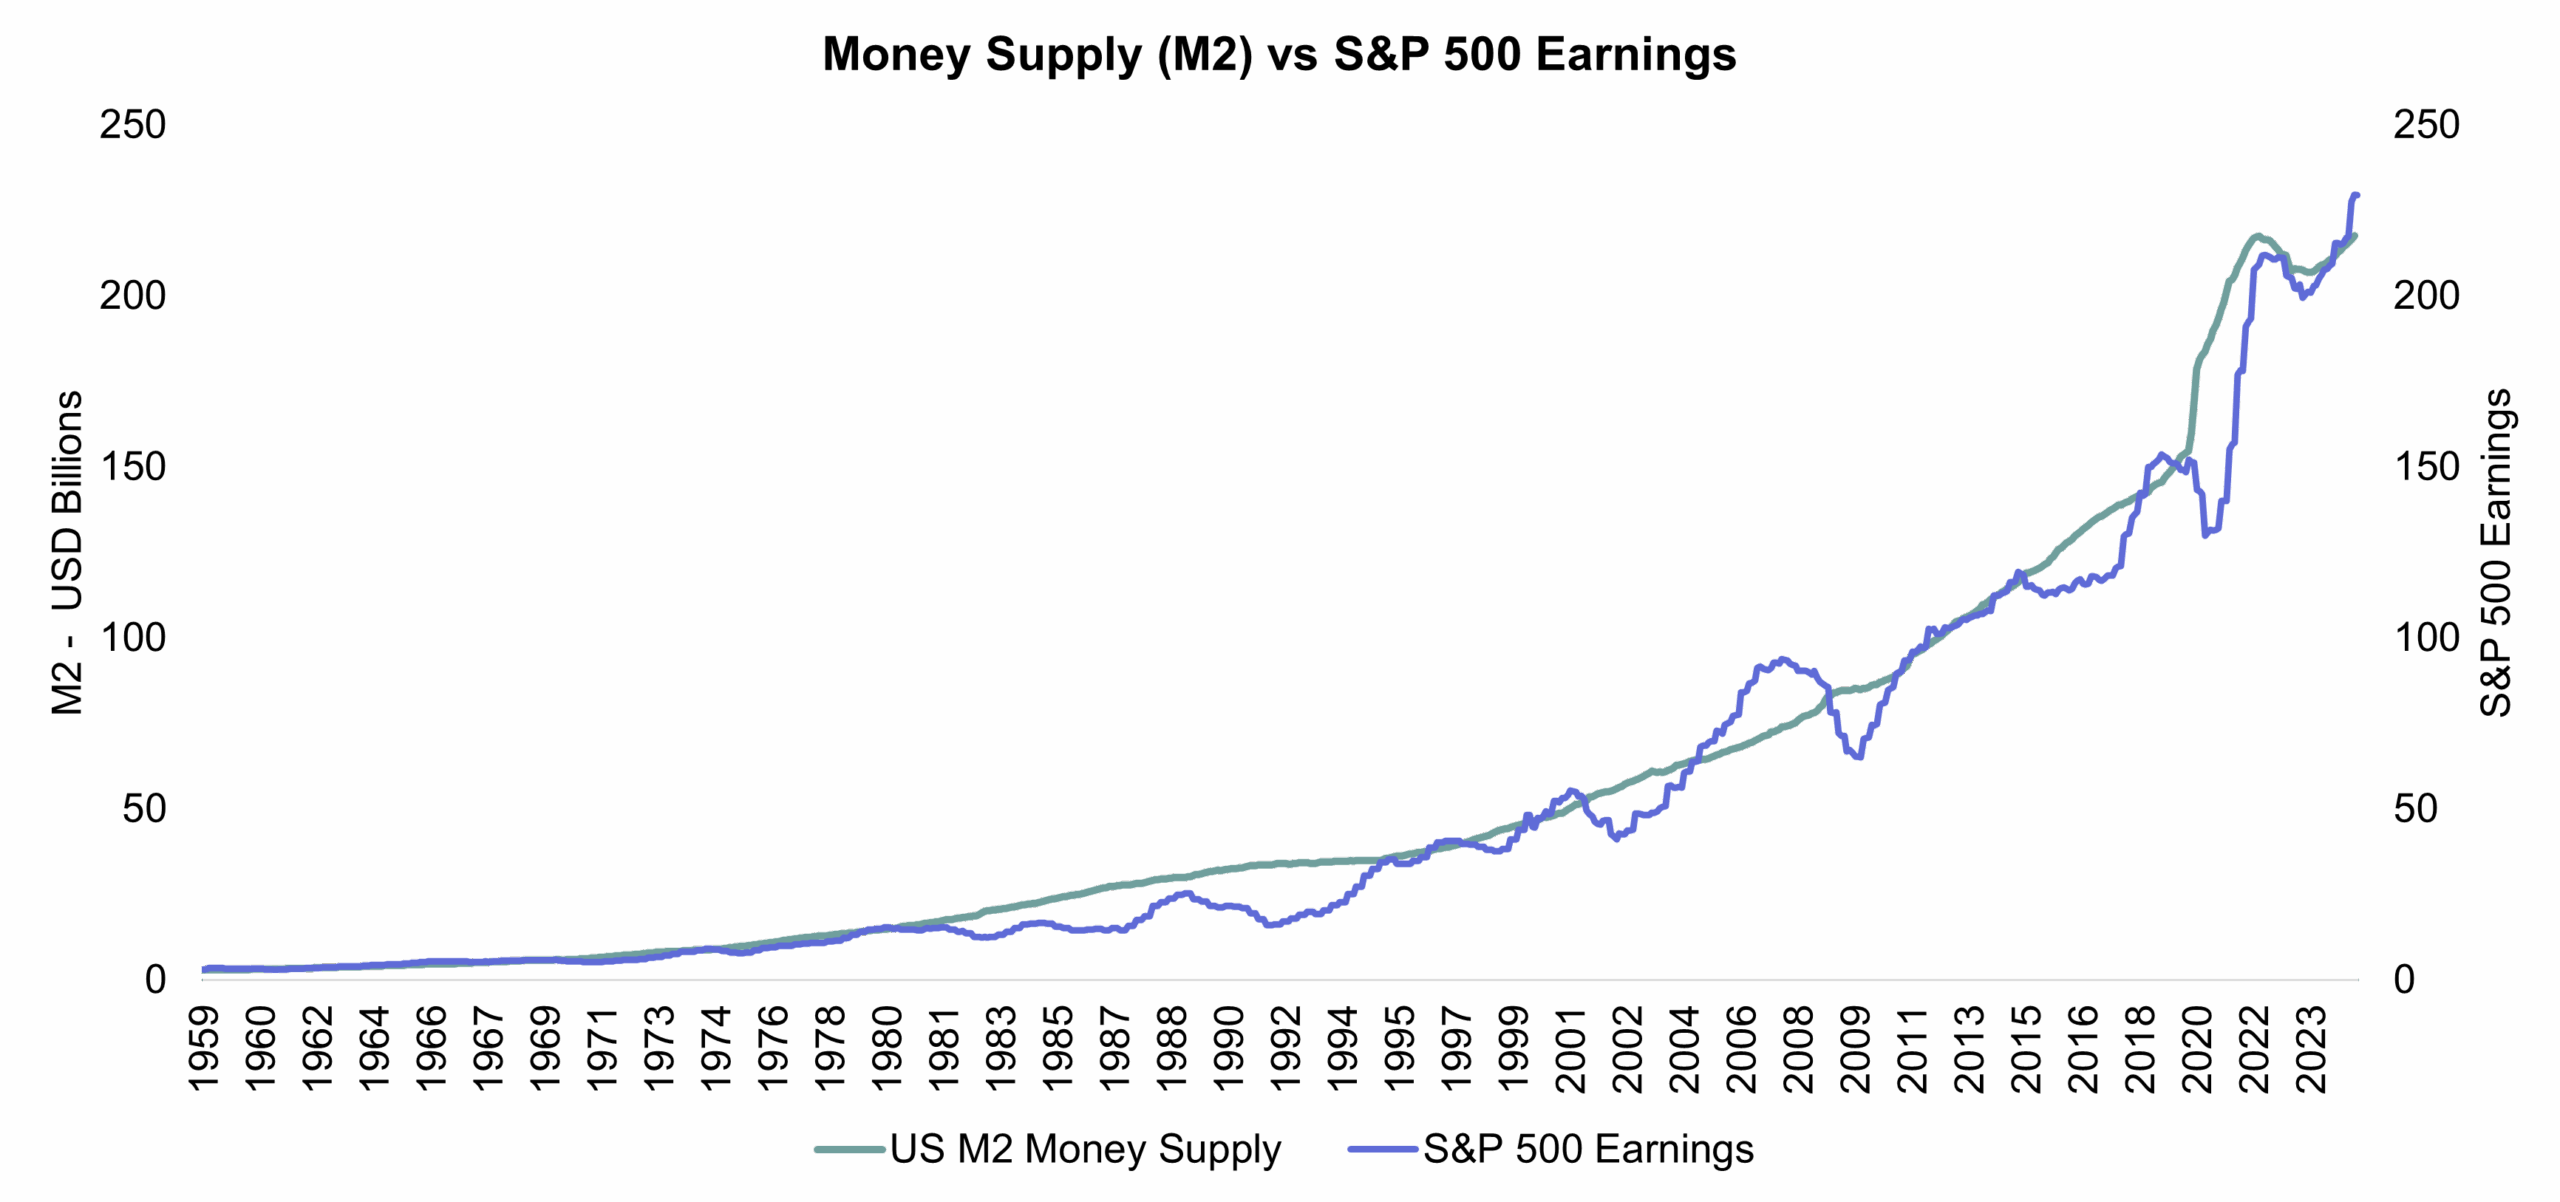
Although not an exact science, the relationship between the money supply and company earnings is evident as expected. Historically earnings increased in line with money supply.
The next graph shows how S&P 500 earnings have changed relative to the money supply. An increasing line indicates that money supply is growing faster than earnings or that earnings are falling and vice versa if the line goes down.

Below, the one-year change in S&P 500 earnings (forward earnings / current earnings) is overlaid on the previous graph. Although the magnitude of chance is not always the same, the earnings follow the ratio of money supply to earnings directionally, with a varying lag, up until July 2023.
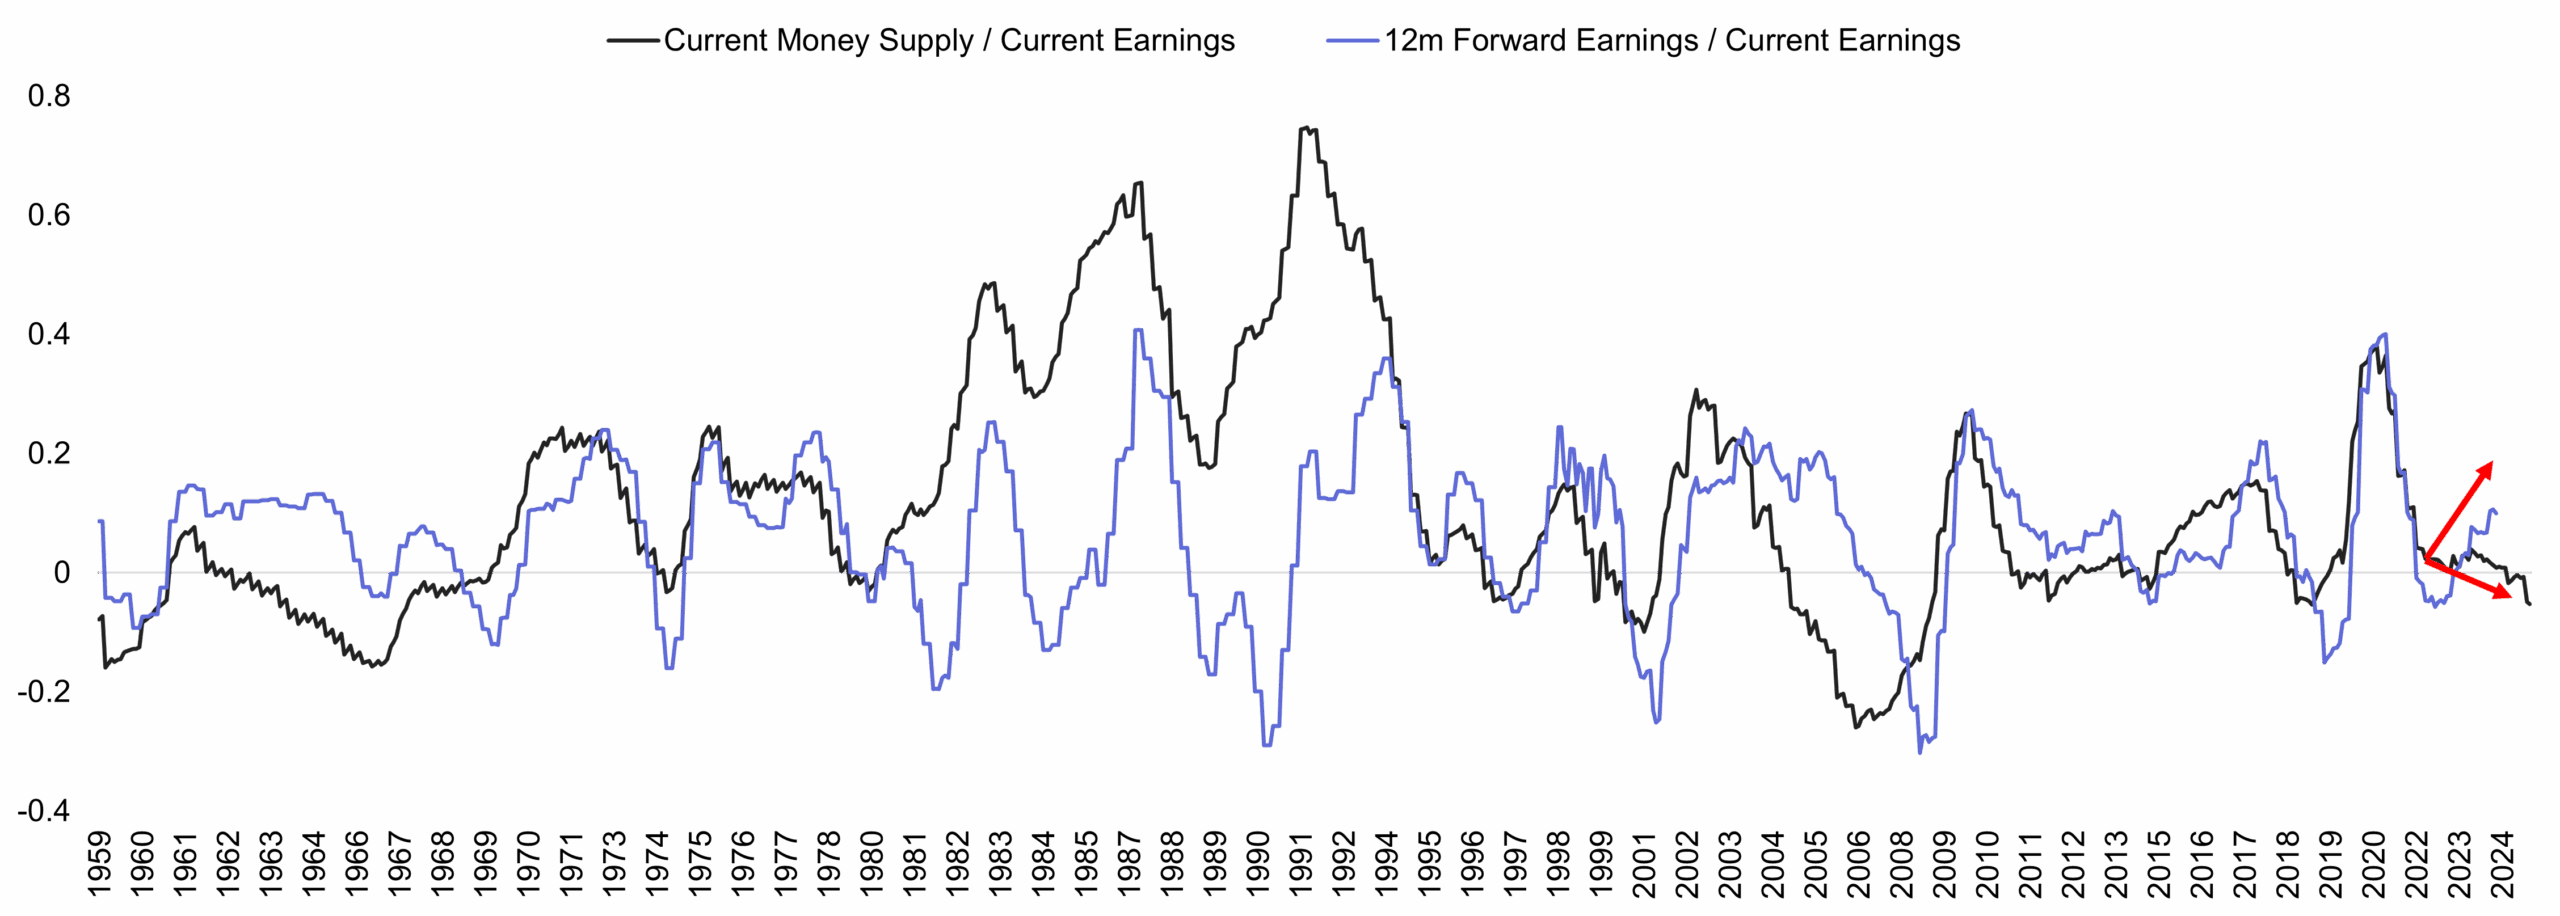
Since July 2023, we have seen the ratio of money supply to earnings trending down, while earnings have been improving (indicated by the red arrows). Using money supply as a leading indicator would suggest that S&P 500 earnings should come under pressure as there is no relative growth in the money supply to support the growth in earnings. The fact that these two ratios are trending in opposite directions, raises concern.
The Price to Earnings (PE) ratio represents what the market is currently willing to pay for one unit of earnings. The market is forward looking and if the market expects earnings to grow / decline, the PE ratio will increase /decrease.
Historically there is a negative relationship between earnings growth and the PE ratio. This indicates that as earnings grow / decline, the market expects slower / higher growth into the future.
The chart below shows this relationship over time (S&P 500 PE and earnings).
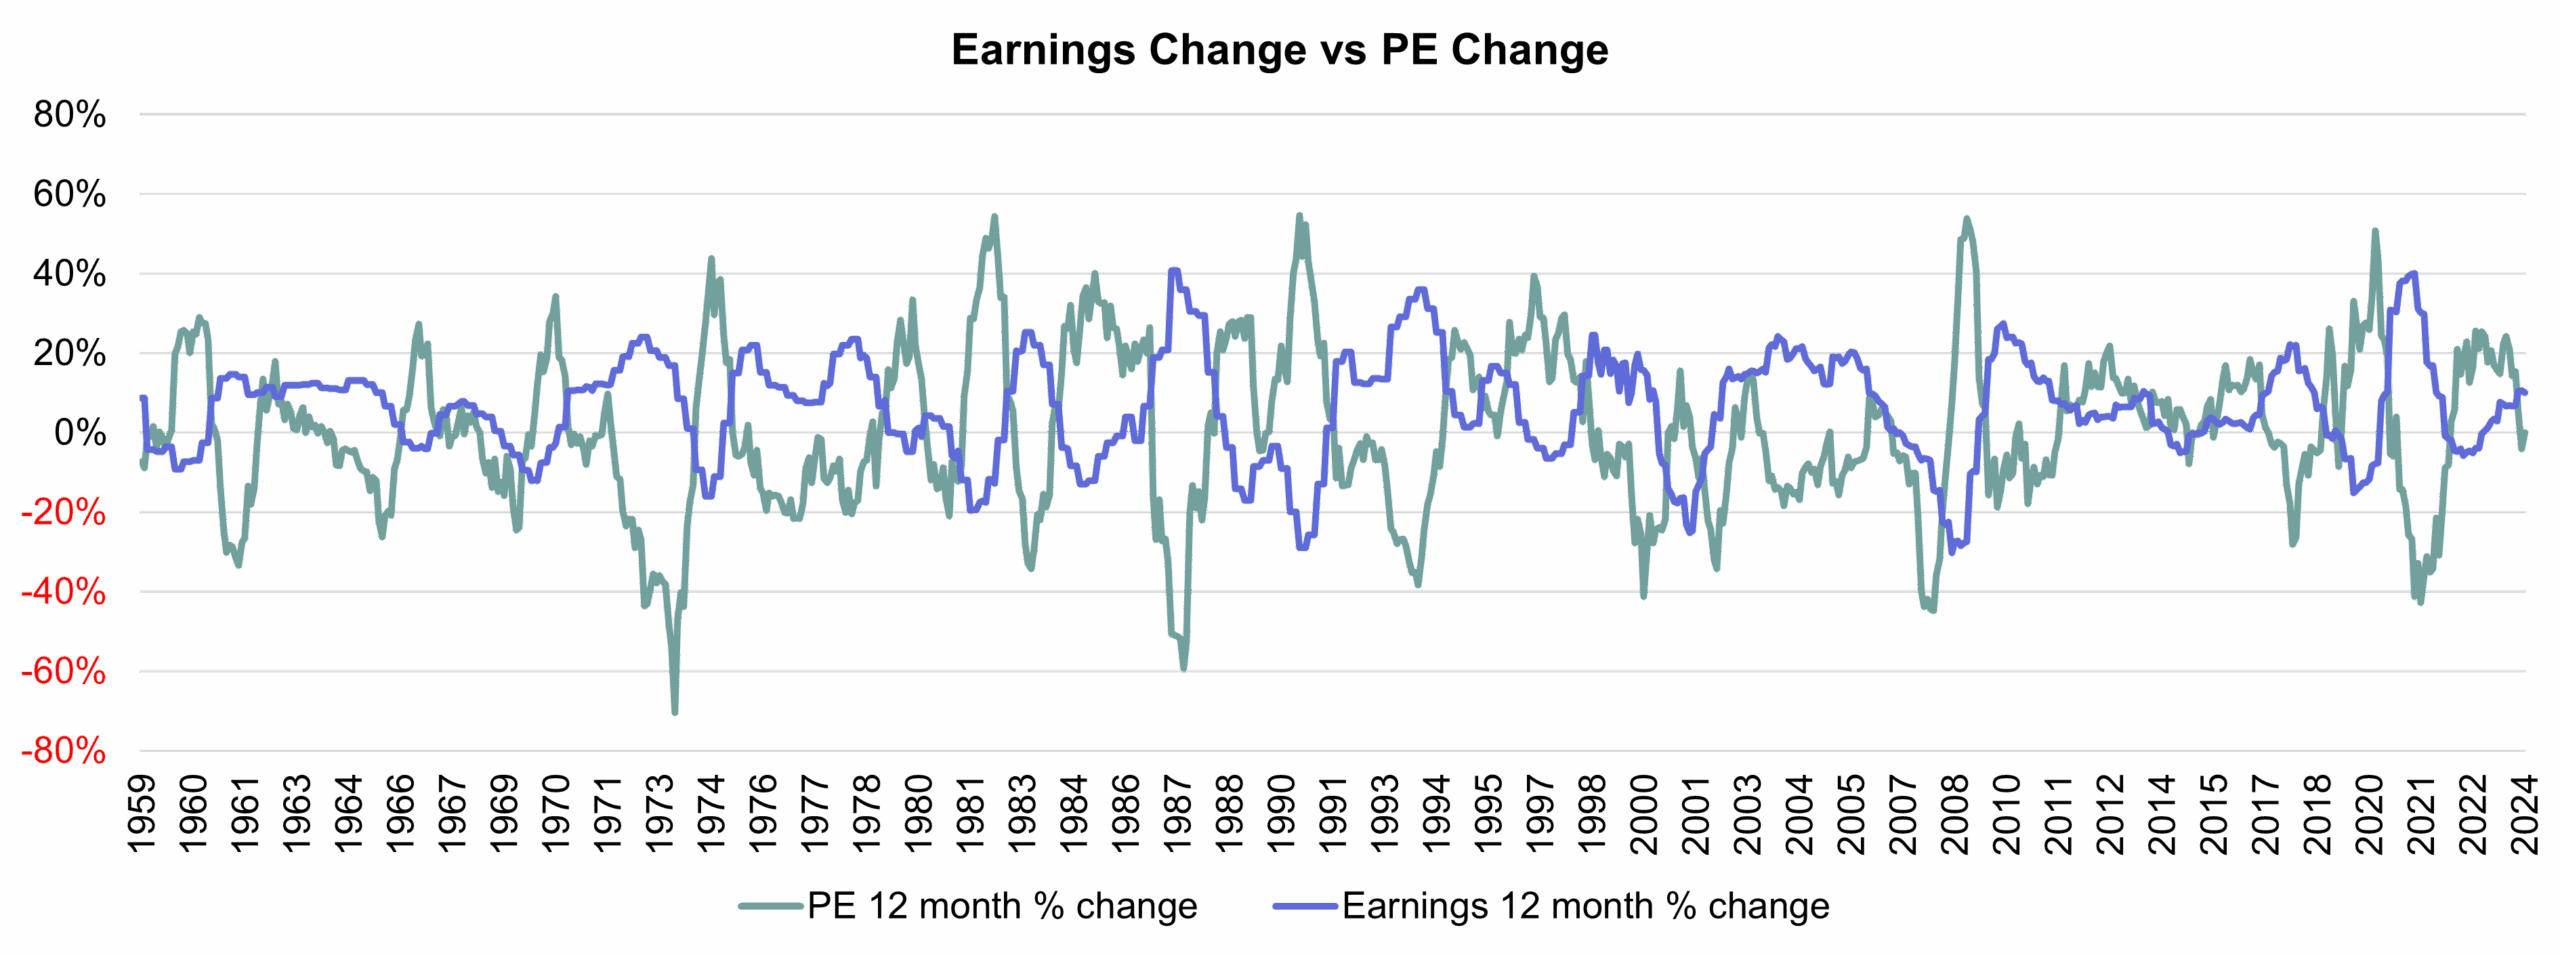
Next, the same information is shown through time (S&P 500 PE and earnings).
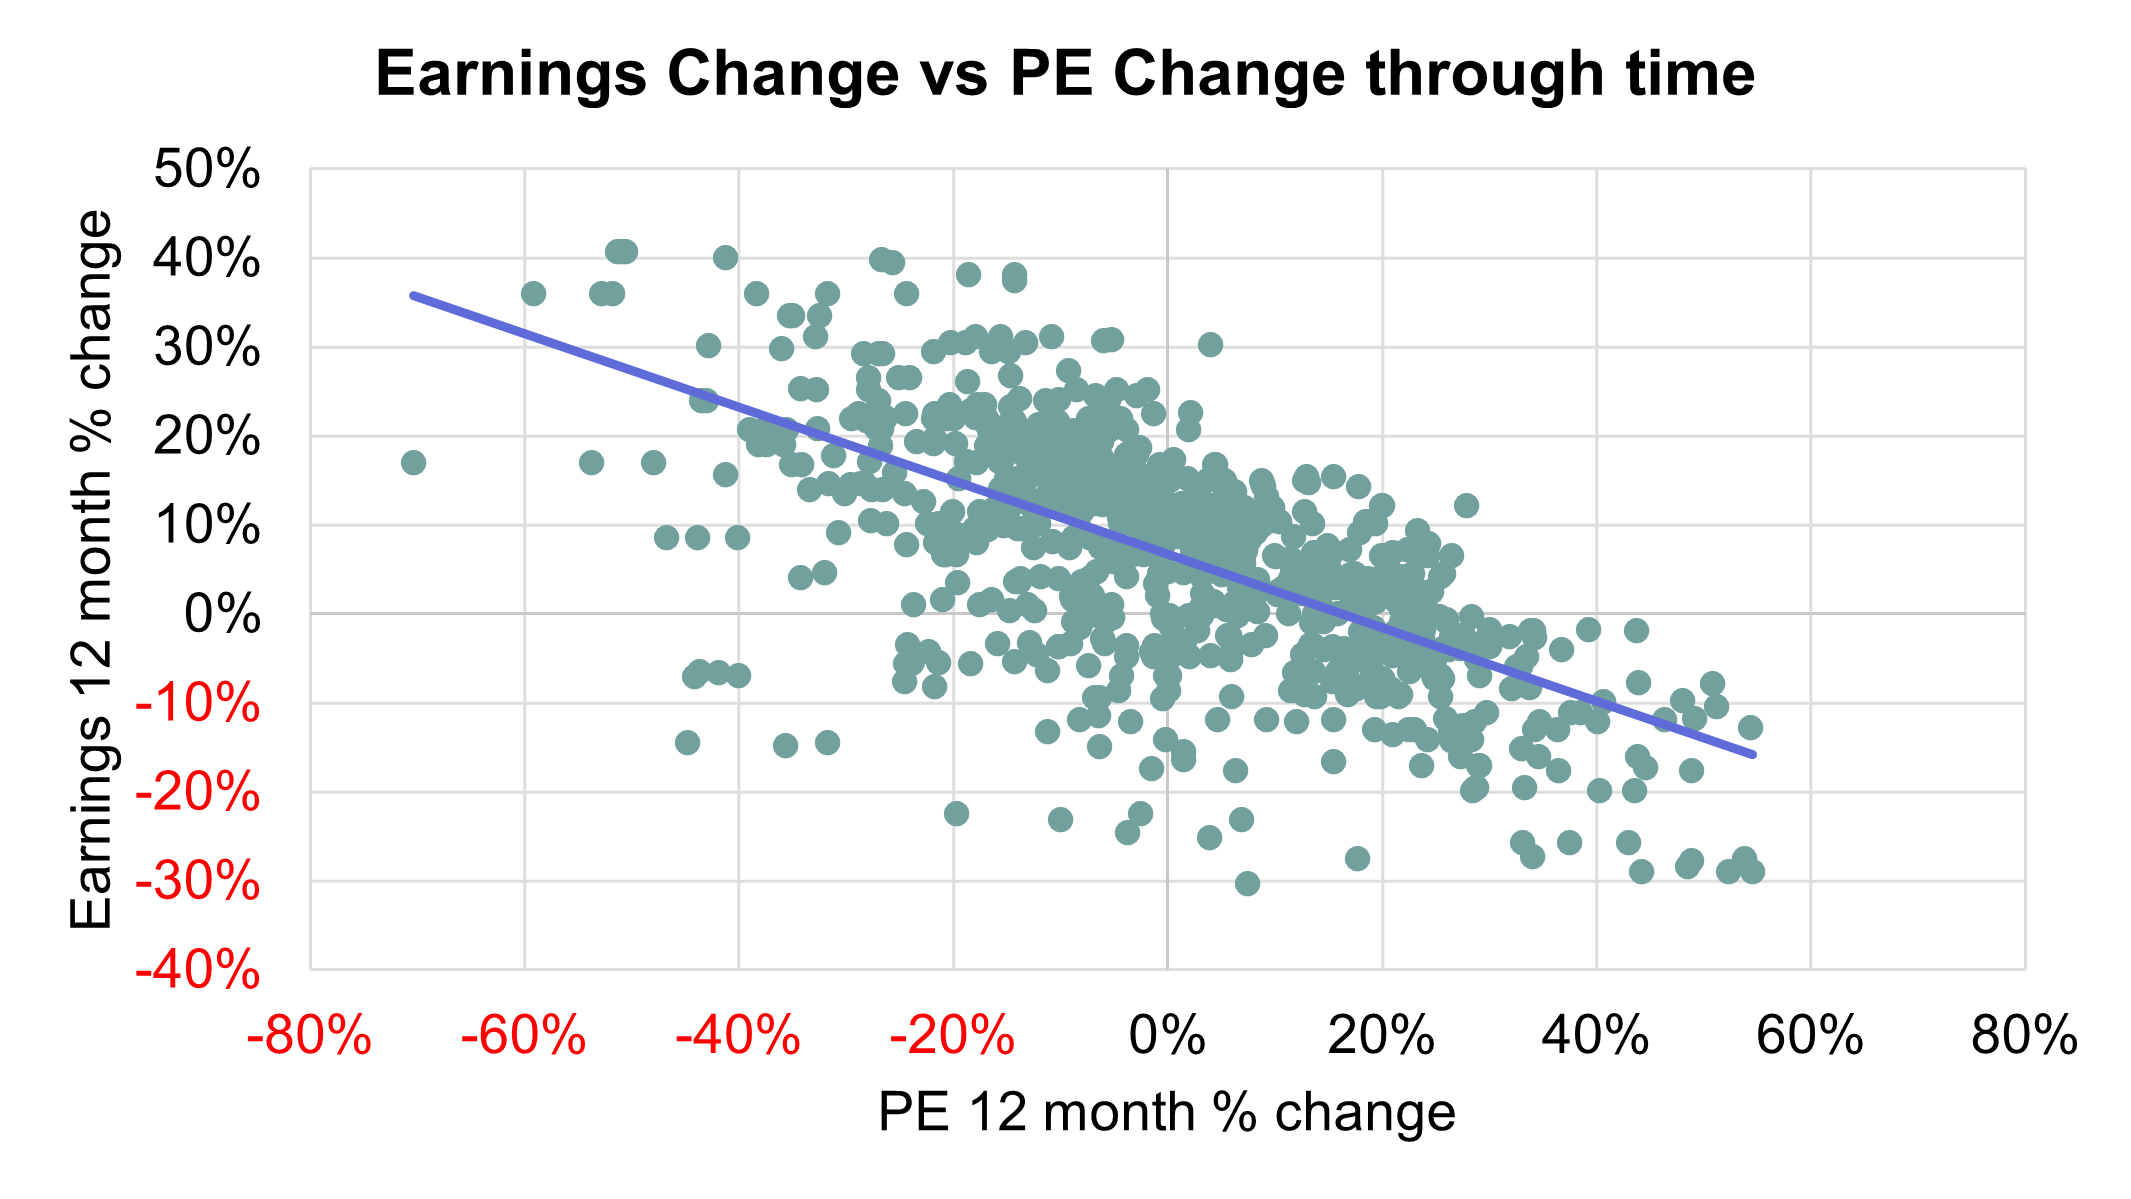
As we expect earnings to come under pressure, we can in turn expect the PE ratio to increase based on historical observations.
The graph below shows the history of the S&P 500 PE ratio. The current PE ratio (end April 2025) of 24.3 is high relative to the historical average level of 17.2.
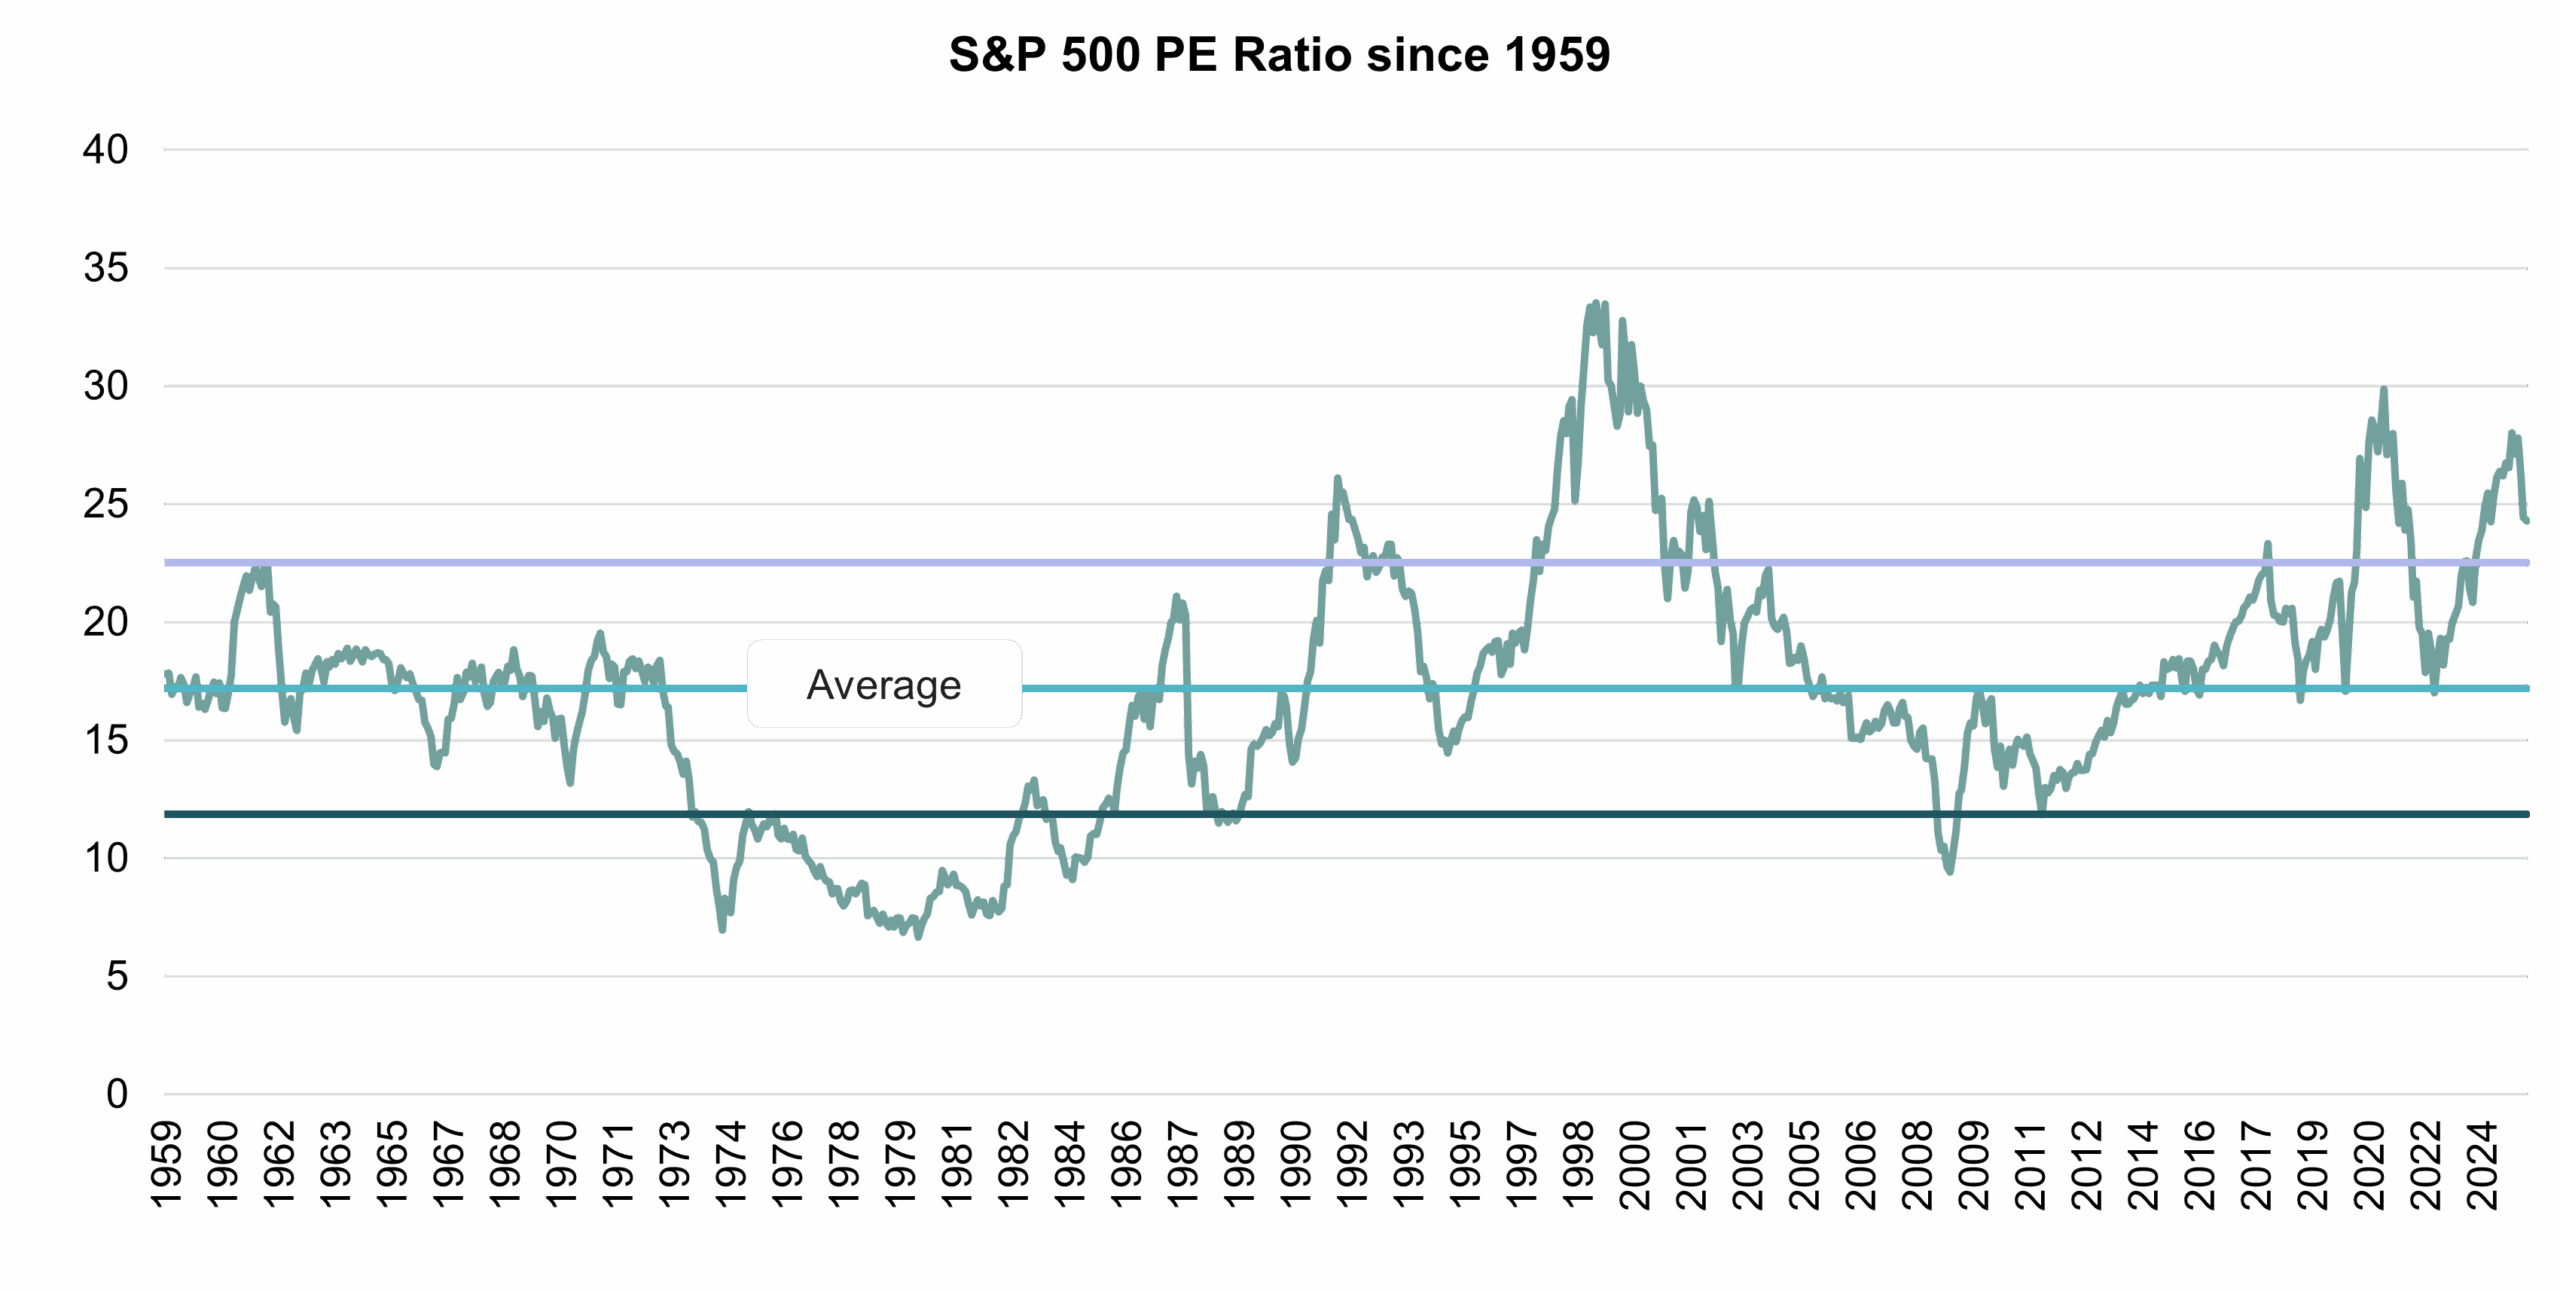
If earnings fall the PE would have to increase from a high base making the market even more expensive. Even though this scenario might play out, a prudent investor would not be aggressive in an expensive market where earnings are not supported by growth in money supply.
The graph below shows the historic PE ratio of the S&P 500 against the one-year forward return. Historically, a PE ratio of 24.3 returned on average 5% one year into the future while the average price return for the S&P 500 since 1959 has been 7.2%.
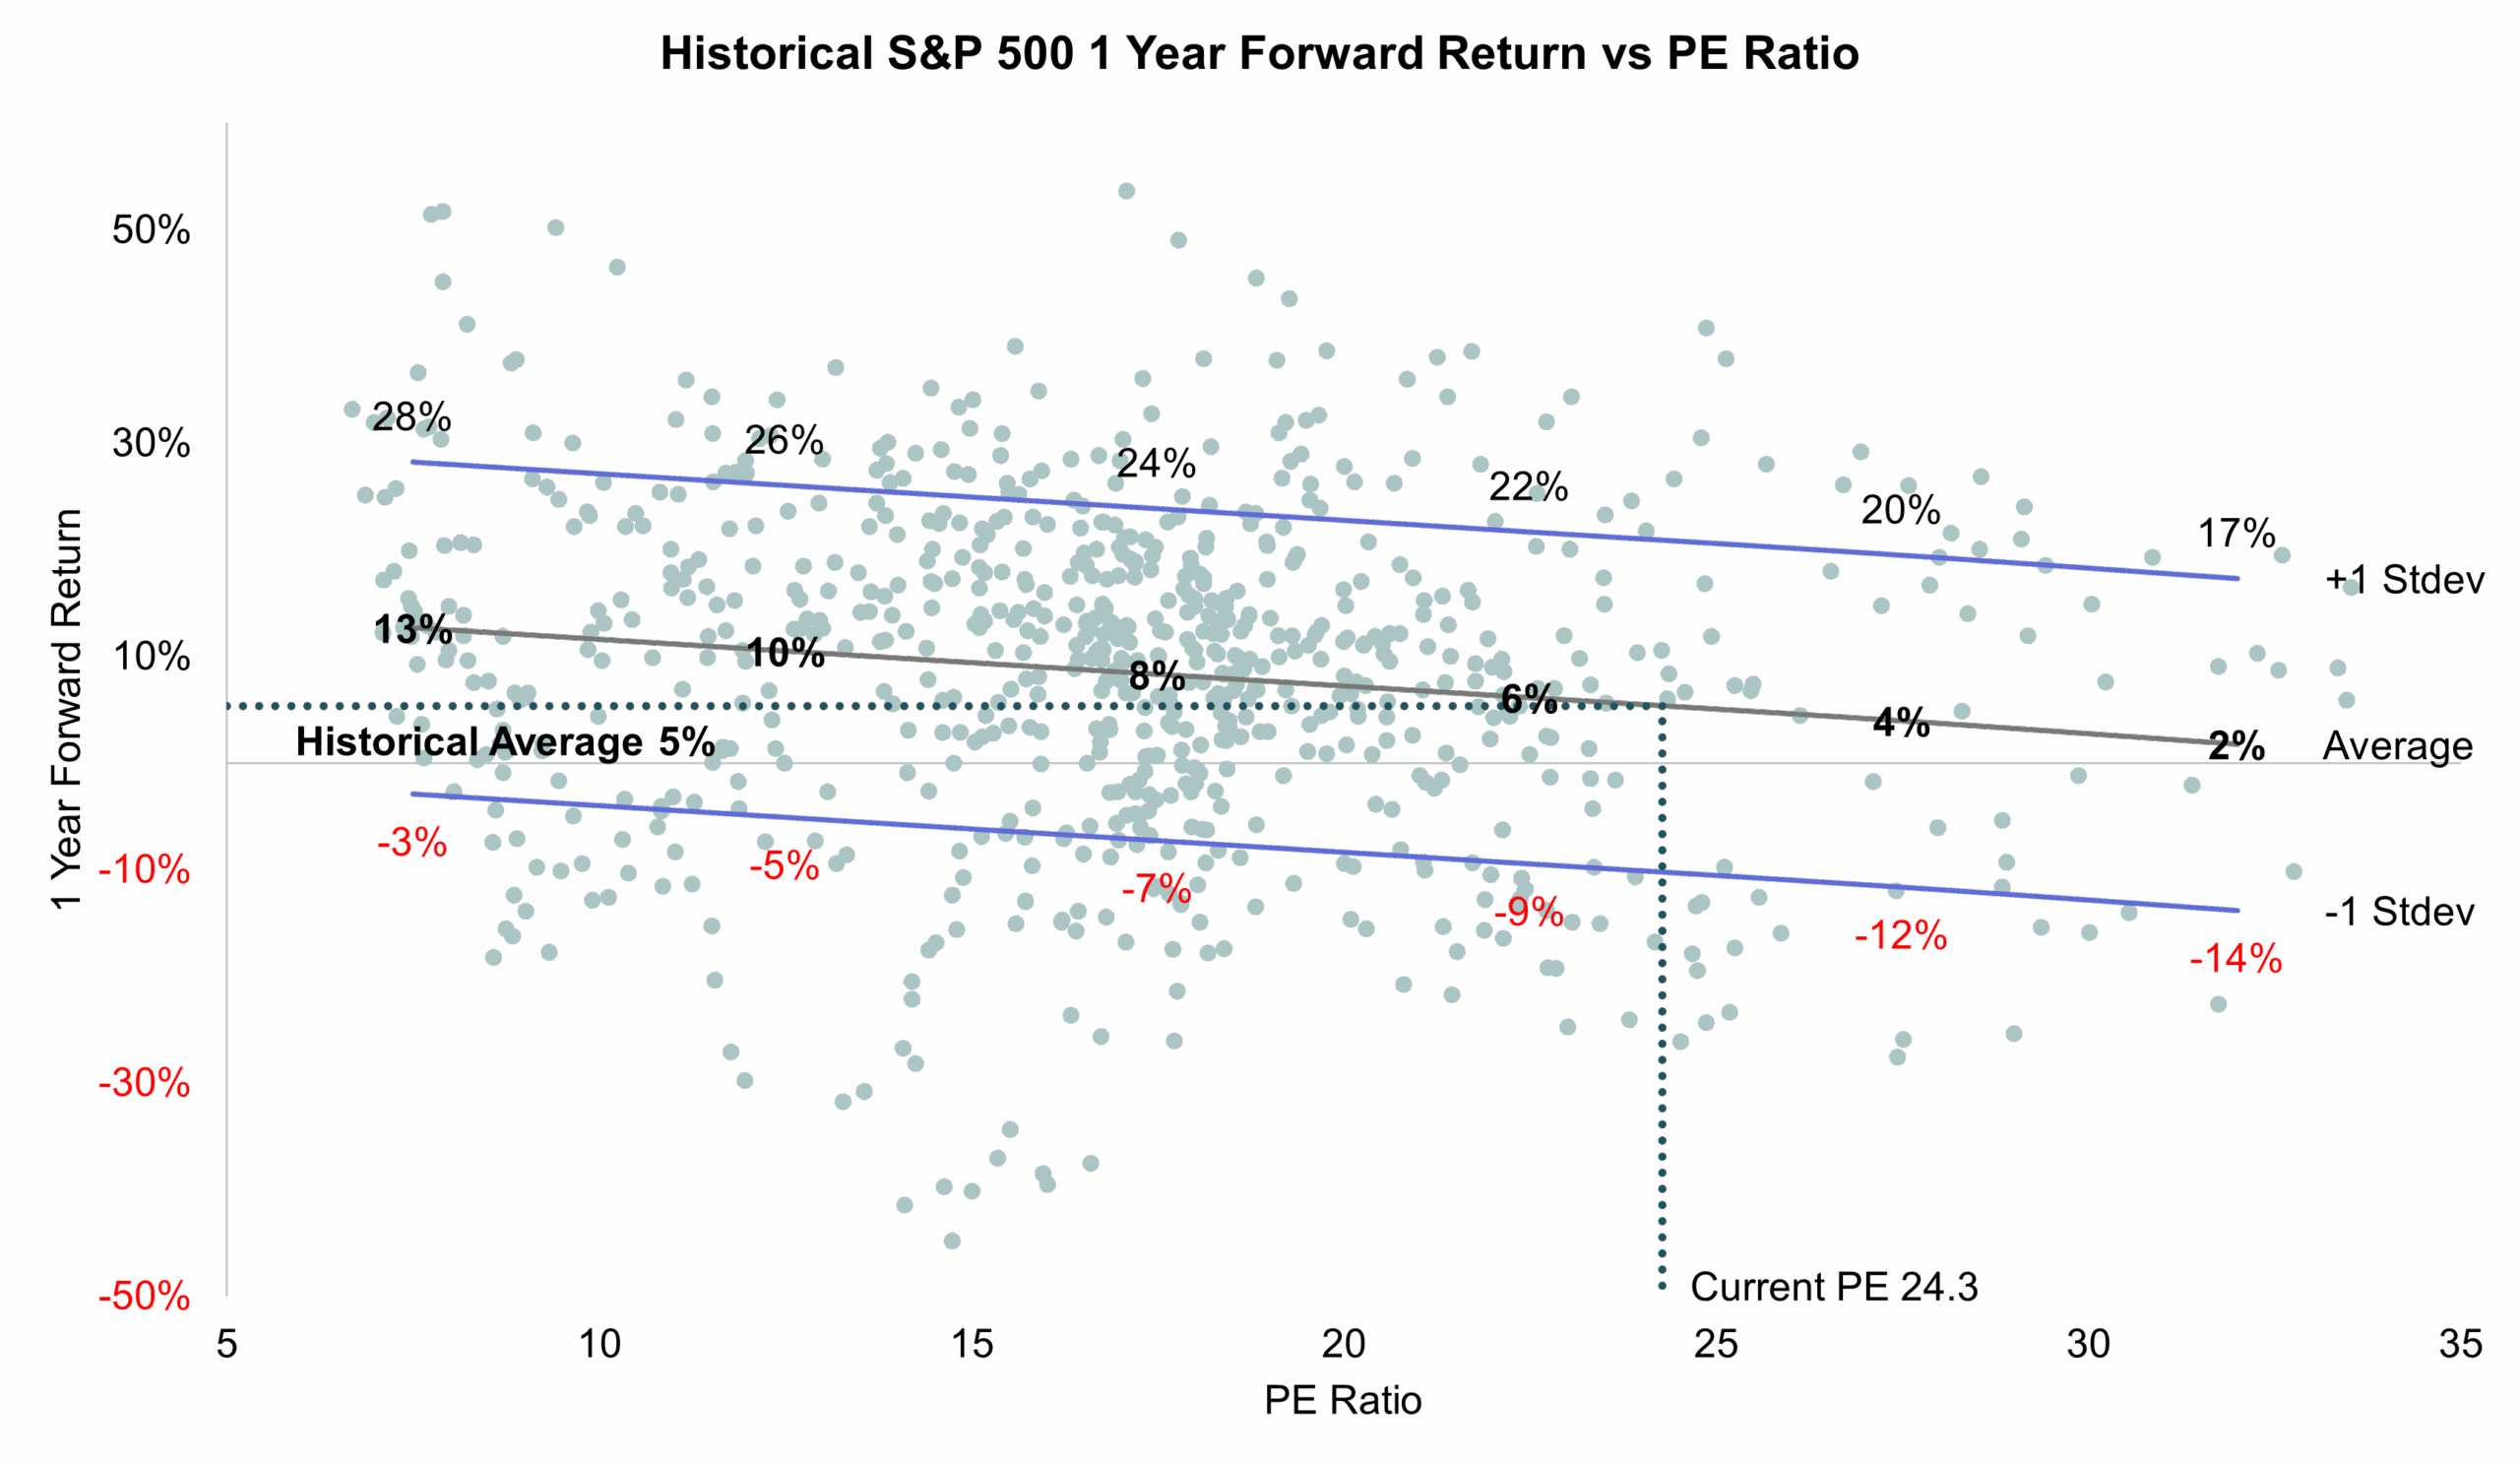
Historically, money supply has been a reliable leading indicator of company earnings. The US money supply is currently decreasing, but S&P 500 earnings are still increasing. Given historical evidence, we would expect S&P 500 earnings to come under pressure. Historically, the PE ratio has increased when earnings fell, but the S&P 500 PE ratio is currently notably higher than the historical average. The resultant market valuation would be even more expensive than the current one.
Based on the disconnect between historical evidence and the current environment, we remain cautious on our outlook.
View the May 2025 Market Summary
ViewABOUT THE AUTHOR:
Henk Myburgh, CFA®- Head of Research
After completing a BCom Econometrics and MSc in Quantitative Risk Management at the North-West University, Henk Myburgh (CFA), started his career in financial risk management at HSBC. He also worked at Sanlam Capital Markets, where his focus was on consolidation of financial risk across the firm and management of risk on a holistic basis. In 2018 he founded AlQuaTra, a quantitative private hedge fund.


